
(T2108 measures the percentage of stocks trading above their respective 40-day moving averages [DMAs]. It helps to identify extremes in market sentiment that are likely to reverse. To learn more about it, see my T2108 Resource Page. You can follow real-time T2108 commentary on twitter using the #T2108 hashtag. T2108-related trades and other trades are occasionally posted on twitter using the #120trade hashtag. T2107 measures the percentage of stocks trading above their respective 200DMAs)
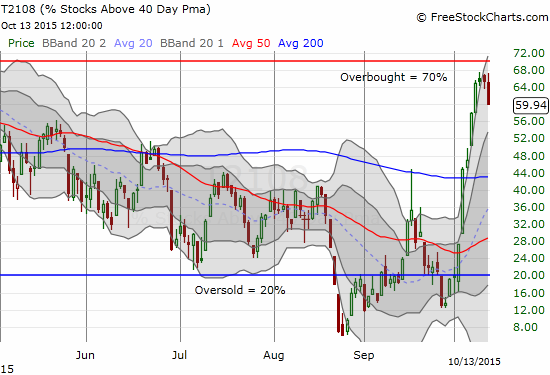
T2108 Status: 59.9%
T2107 Status: 27.8%
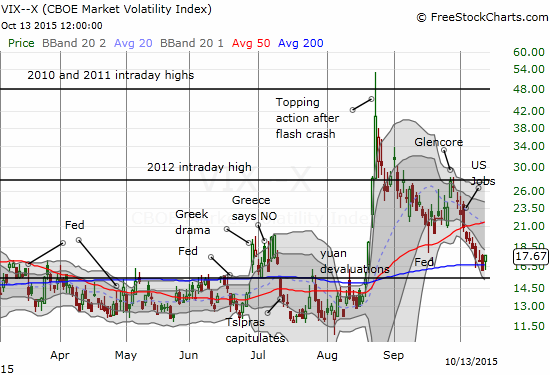
VIX Status: 17.7 (small bounce off 200DMA)
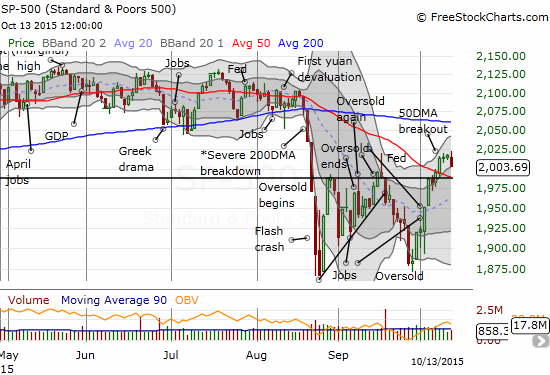
General (Short-term) Trading Call: Neutral (target of 1996 on the S&P 500 occurred ahead of overbought conditions. See “From the Edge of A Breakout to the Ledge of A Breakdown” for more details).
Active T2108 periods: Day #8 over 20%, Day #7 over 30%, Day #7 over 40%, Day #5 over 50% (overperiod), Day #1 under 60% (ending 3 days over 60%), Day #322 under 70%
Reference Charts (click for view of last 6 months from Stockcharts.com):
S&P 500 or SPY
SDS (ProShares UltraShort S&P500)
U.S. Dollar Index (volatility index)
EEM (iShares MSCI Emerging Markets)
VIX (volatility index)
VXX (iPath S&P 500 VIX Short-Term Futures ETN)
EWG (iShares MSCI Germany Index Fund)
CAT (Caterpillar).
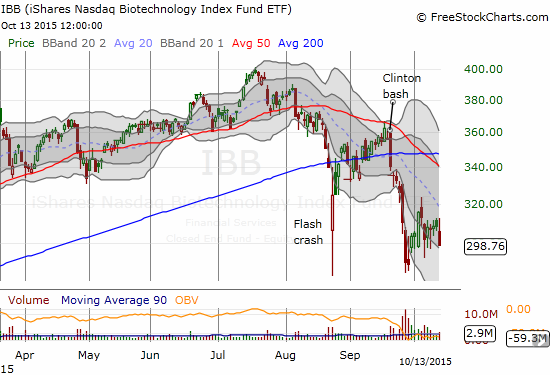
IBB (iShares Nasdaq Biotechnology).
Commentary
322 trading days and counting since T2108 last traded in overbought conditions. I thought THIS would be the week for finally bringing the streak to an end, but T2108 took a sharp detour today.
In parallel, the S&P 500 (SPY) lost a fraction of a percent as the index turned its back on the recent 50DMA breakout.
The small loss on the day helped the volatility index, the VIX, finally end its 10-day losing streak. The VIX jumped 9.3% with a bounce off its 200DMA.
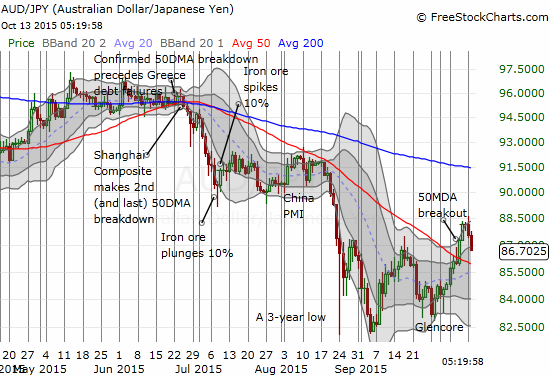
The big rally in the Australian dollar came to a screeching halt. As I have indicated before, I am VERY skeptical about the sustainability of this rally.
Earnings season has begun so, as always during this time, I am staying away from overplaying my hand with the technical calls. However, I think it is very surprising that the volatility index declined so steadily going into earnings season. This decline sets up the potential for some very disruptive moves if any major company delivers particularly bad news. So with T2108 scraping at overbought levels, a volatility index hovering above the 15.35 pivot, and a market taking a suddenly calm outlook on earnings, I am definitely avoiding any major bullish bets. (Trading call is still neutral).
On a related noted, I have pumped the brakes on the trade on iShares Nasdaq Biotechnology (IBB). I have written several pieces on this trade ever since Presidential candidate Hillary Clinton bashed the sector. The rally off the bottom has definitely stalled and could even be poised to make at least one more lower low. I think at this point, it makes sense to wait to see whether IBB can generate another big swoosh of selling and/or a retest of the big low last month on high selling volume. Note well that a breakout from the current consolidation might run IBB right into declining 50DMA resistance. My upside target remains a complete reversal of the post-Clinton selling.
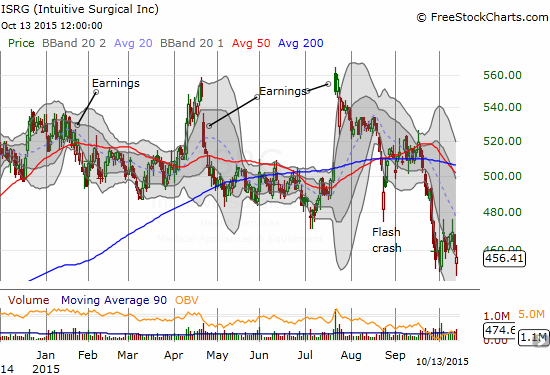
Speaking of the health care sector, Intuitive Surgical (ISRG) has my attention again as the stock briefly cracked 52-week lows. The stock is on the edge of a major breakdown ahead of earnings next week on October 20th. I am always biased on ISRG to look for a buying opportunity, but the current trading action looks very bearish.
Daily T2108 vs the S&P 500
")
Black line: T2108 (measured on the right); Green line: S&P 500 (for comparative purposes)
Red line: T2108 Overbought (70%); Blue line: T2108 Oversold (20%)
Weekly T2108

*All charts created using freestockcharts.com unless otherwise stated
The charts above are the my LATEST updates independent of the date of this given T2108 post. For my latest T2108 post click here.
Related links:
The T2108 Resource Page
Expanded daily chart of T2108 versus the S&P 500
Expanded weekly chart of T2108
Be careful out there!
Full disclosure: long SVXY shares, short AUD/JPY, net long U.S. dollar, long GLD