
(T2108 measures the percentage of stocks trading above their respective 40-day moving averages [DMAs]. It helps to identify extremes in market sentiment that are likely to reverse. To learn more about it, see my T2108 Resource Page. You can follow real-time T2108 commentary on twitter using the #T2108 hashtag. T2108-related trades and other trades are occasionally posted on twitter using the #120trade hashtag. T2107 measures the percentage of stocks trading above their respective 200DMAs)
T2108 Status: 23.9% (Ends a 4-day oversold period).
T2107 Status: 23.2%
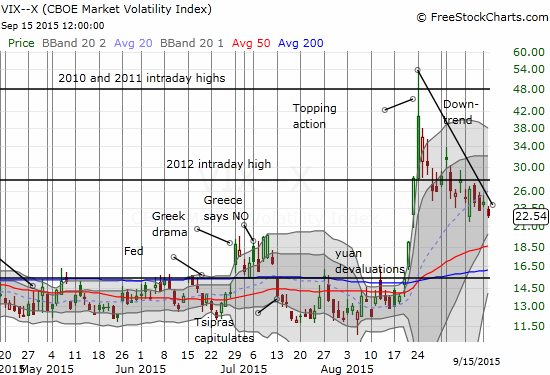
VIX Status: 22.5
General (Short-term) Trading Call: Bullish
Active T2108 periods: Day #1 over 20% (ends 4-day oversold period), Day #12 under 30%, Day #41 under 40%, Day #81 under 50%, Day #98 under 60%, Day #296 under 70%
Reference Charts (click for view of last 6 months from Stockcharts.com):
S&P 500 or SPY
SDS (ProShares UltraShort S&P500)
U.S. Dollar Index (volatility index)
EEM (iShares MSCI Emerging Markets)
VIX (volatility index)
VXX (iPath S&P 500 VIX Short-Term Futures ETN)
EWG (iShares MSCI Germany Index Fund)
CAT (Caterpillar).
Commentary
I guess the post-Fed fade of volatility is more like a pre-Fed fade. Closed out some anti-vol trades here. $UVXY puts $SVXY shares. #VIX
— Duru A (@DrDuru) Sep. 15 at 12:06 PM
I guess traders are front-running the typical Fed behavior to calm markets and reduce volatility after making a decision on monetary policy. The resulting moves in the volatility products were so strong that I closed out over half of my “anti-volatility” positions to lock in profits. The rest remains as part of my trade on T2108 oversold conditions. The more volatility declines AHEAD of the Fed meeting, the more wary I get about volatility’s post-Fed behavior. I have adjusted my strategy to fade a volatility surge EITHER before or after the meeting. The “before” case looks very unlikely now.
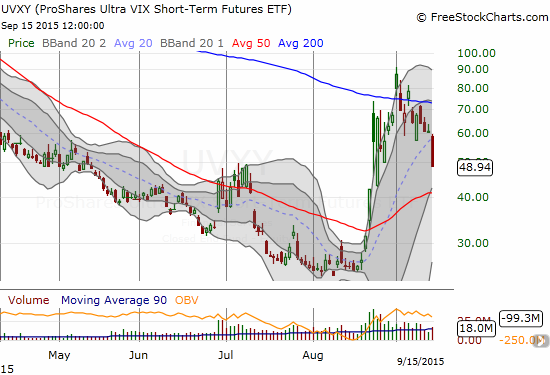
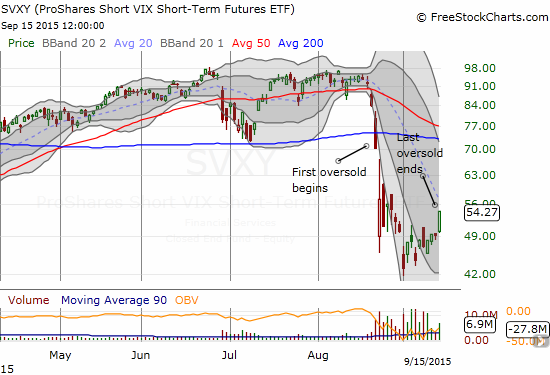
Note well how the 200-day moving average (DMA) is now confirmed resistance for the ProShares Ultra VIX Short-Term Futures (UVXY). It is finally poised to return to its usual behavior: trending ever downward. However, the 50DMA’s upturn suggests UVXY will not go back to its misery without a fight. At the opposite end, the ProShares Short VIX Short-Term Futures (SVXY) has yet to recover lost ground over the last two oversold periods.
The volatility index, the VIX, closed at 22.5, right where it opened the day before the flash crash. In parallel, T2108 closed at 23.9%, right where it opened that same day (August 21, 2015).
While T2108 made a strong push out of oversold conditions, the S&P 500 has yet to break out from its churn from the two oversold periods. The index closed marginally higher than its close on the first day of the first oversold period.
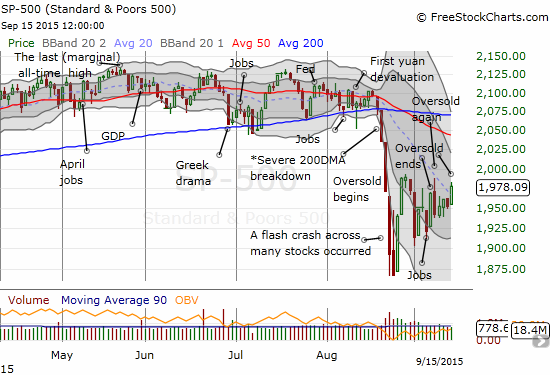
I will be VERY surprised if the market makes much more progress ahead of the Fed meeting, but it is clear that buyers are slowly but surely trying to regain control of the market. With the end of the second oversold period, conservative T2108 traders can begin to make select buys again. As I have mentioned before, waiting this long to trade on an oversold period has its benefit in limiting potential drawdowns during the oversold period. However, I find trades from here trickier to navigate as a return into oversold territory will force decisions to stop out of trades that can generate whiplash.
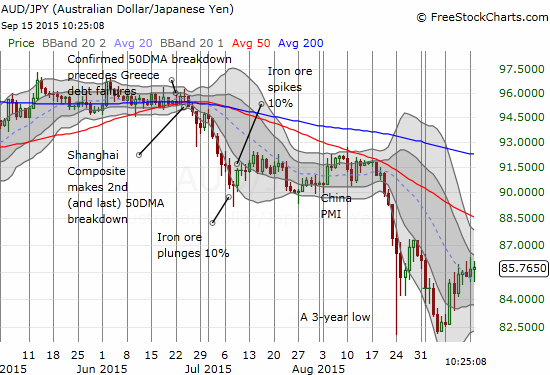
I am avoiding any more chart reviews given the Fed’s much anticipated decision on Thursday has the potential to alter the trading landscape in dramatic fashion. I will just conclude with a forex-related check on market sentiment. The Australian dollar (FXA) versus the Japanese yen (FXY), AUD/JPY, is still flagging caution. Like the S&P 500, AUD/JPY found a bottom at the flash crash intraday bottom. That bottom was much delayed and signaled that the first oversold bounce would likely lose steam. AUD/JPY is still lagging the S&P 500 as it is well below its oversold high and still has a downtrending pattern of lower highs and lower lows on a closing basis.
Oh yeah, in case you were wondering, here are the month-based odds for the first Fed rate hike. Despite all the hand-wringing about a September hike, the market stopped believing in a September hike many weeks ago.
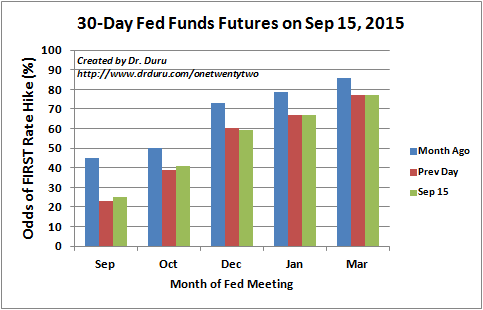
Source: CME Group FedWatch
A Federal Reserve that wants to keep volatility under wraps does NOT contradict the market…
Daily T2108 vs the S&P 500
")
Black line: T2108 (measured on the right); Green line: S&P 500 (for comparative purposes)
Red line: T2108 Overbought (70%); Blue line: T2108 Oversold (20%)
Weekly T2108

*All charts created using freestockcharts.com unless otherwise stated
The charts above are the my LATEST updates independent of the date of this given T2108 post. For my latest T2108 post click here.
Related links:
The T2108 Resource Page
Expanded daily chart of T2108 versus the S&P 500
Expanded weekly chart of T2108
Be careful out there!
Full disclosure: long SVXY shares, long SSO shares, short AUD/JPY