
(T2108 measures the percentage of stocks trading above their respective 40-day moving averages [DMAs]. It helps to identify extremes in market sentiment that are likely to reverse. To learn more about it, see my T2108 Resource Page. You can follow real-time T2108 commentary on twitter using the #T2108 hashtag. T2108-related trades and other trades are occasionally posted on twitter using the #120trade hashtag. T2107 measures the percentage of stocks trading above their respective 200DMAs)
T2108 Status: 15.2% (jump of 27.3%)
T2107 Status: 20.8%
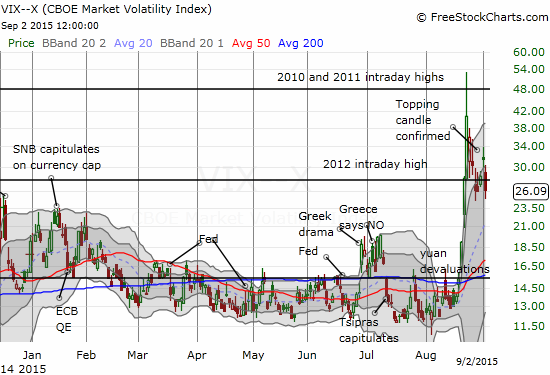
VIX Status: 26.1 (down 16.9%)
General (Short-term) Trading Call: Bullish
Active T2108 periods: Day #9 below 20% (oversold), Day #10 under 30%, Day #33 under 40%, Day #73 under 50%, Day #90 under 60%, Day #288 under 70%
Reference Charts (click for view of last 6 months from Stockcharts.com):
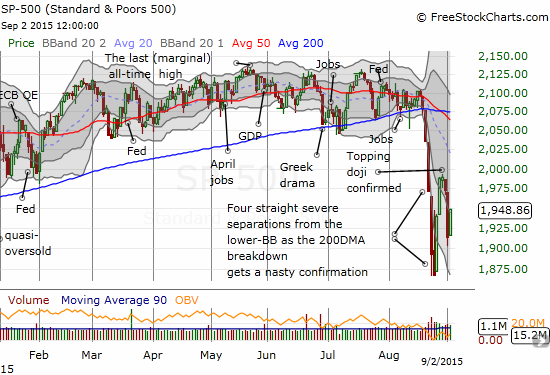
S&P 500 or SPY
SDS (ProShares UltraShort S&P500)
U.S. Dollar Index (volatility index)
EEM (iShares MSCI Emerging Markets)
VIX (volatility index)
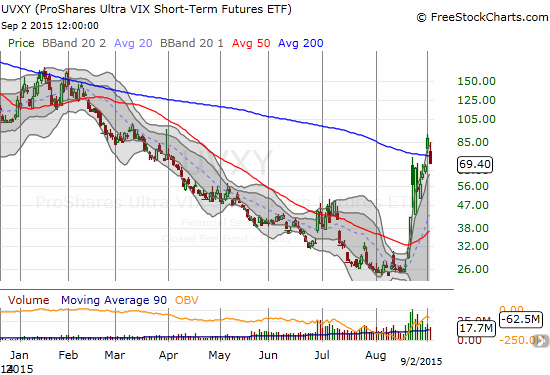
VXX (iPath S&P 500 VIX Short-Term Futures ETN)
EWG (iShares MSCI Germany Index Fund)
CAT (Caterpillar).
Commentary
I am writing this T2108 Update with a HEAVY dose of tentativeness. Just yesterday, sellers were able to extend this oversold period into historic territory, so I can only talk about bullish signs with a salt shaker on the table. While T2108 is once again within a stone’s throw of ending this oversold period with its close at 15.2%, I am very cognizant of the possibility for more churn ahead that could include a rapid return to oversold conditions.
On Wednesday, September 2, 2015, at least two measures of volatility printed what I interpret as major and important topping patterns.
The volatility index, the VIX, dropped out of the dangerzone. This second time left behind a clear topping pattern known as a spinning top; one could even call it an abandoned baby top. In this pattern, folks who chased volatility higher suddenly found themselves with instant losses the very next day. The pressure is now on them to decide whether to wait for a new surge or to bail quickly and limit losses.
Less aggressive traders once again get the green light to start making T2108 oversold trades (buys). While this is still a tough time to buy given the S&P 500 (SPY) printed its own topping pattern after a 2-day rally, at least the index is trading below where it stood when the VIX last fell out of the dangerzone (last Thursday and Friday, August 27th and 28th). This discount could come in handy for enhancing profits on the way back up. Less aggressive traders should be prepared to stop out of new positions on a new low for the S&P 500.
Sandwiched between the topping patterns of the VIX and the S&P 500 is the potential for a LOT more churn. While the S&P 500 is a tough call here for new entries, I am liking a fade of volatility more and more. I think there are three main catalysts ahead which could be powerful enough to force resolution of the tension: the monetary policy decision from the European Central Bank (ECB) on the morning of September 3rd, the U.S. jobs report on Friday the 4th, and, of course, the rate decision from the U.S. Federal Reserve on September 17th.
The second, and potentially even MORE interesting, topping pattern for volatility comes from the oil patch. The CBOE Crude Oil Volatility Index (OVX), a volatility measure based on the United States Oil ETF (USO), soared as much as 29% before completely fading and ending the day DOWN 6.5%. At its high, OVX made a new intraday high for the year. The end result was a potentially major blow-off top. This means the most fearful players in the market who were bidding up the price of protection may have finally exhausted themselves.
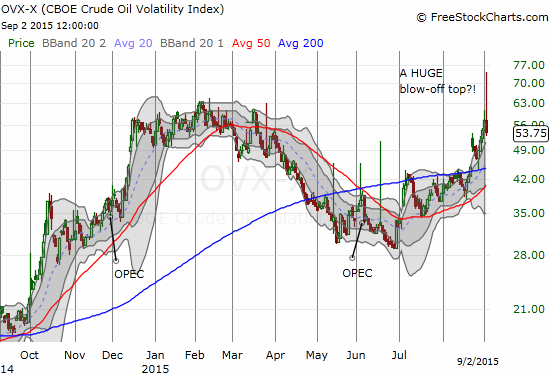
I have successfully used OVX to signal some key oil-related trades (and I wish I had used it MORE consistently!), so this major move made me sit up straight. I believe the message now is that the United States Oil ETF (USO) will finally start to calm down. After USO made its incredible V-bottom, I projected a 50% retracement of those gains. USO bounced nearly perfectly off that 50% point. The subsequent intra-day rally accompanied a major taming of volatility. Unfortunately, I was not prepared to jump at the bounce from the 50% retracement level.
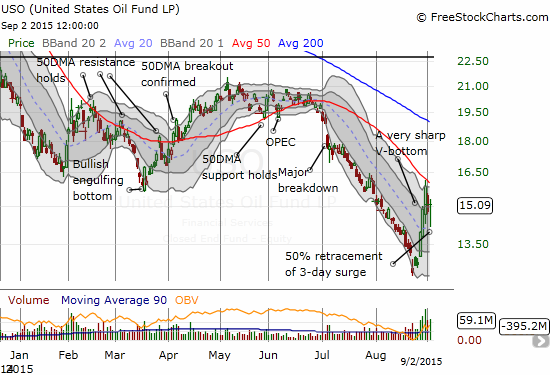
Despite the topping patterns in volatility, today was another generally quiet day for trades. It FELT like a day I should be doing SOMETHING, but I greatly resisted the temptation to venture far off my T2108 trading results to, effectively, take random shots at a few select buying opportunities. USO was a huge exception.
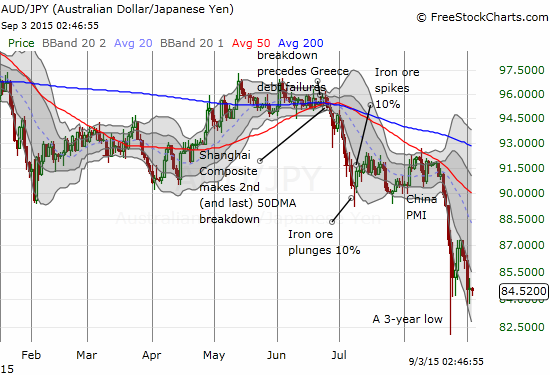
Finally, the Australian dollar (FXA) continues to cling to 3-year lows against the Japanese yen (FXY). My favorite currency indicator is warning me that any kind of stock market bottom must be considered tenuous until it proves itself. “Proof” could come from a major breakout of the S&P 500 from its most immediate topping pattern.
Daily T2108 vs the S&P 500
")
Black line: T2108 (measured on the right); Green line: S&P 500 (for comparative purposes)
Red line: T2108 Overbought (70%); Blue line: T2108 Oversold (20%)
Weekly T2108

*All charts created using freestockcharts.com unless otherwise stated
The charts above are the my LATEST updates independent of the date of this given T2108 post. For my latest T2108 post click here.
Related links:
The T2108 Resource Page
Expanded daily chart of T2108 versus the S&P 500
Expanded weekly chart of T2108
Be careful out there!
Full disclosure: long SVXY shares, long SSO shares and call options, short USO call spread, short USO put options
Hi Duru, nice site. Terrible retail sales data from Australia today has me seeling more AU!
Thanks for reading! This is my main site. I put all my technical analysis here.
I hope to write at the end of the week a summary of all we learned from the Australian economic data.