
(T2108 measures the percentage of stocks trading above their respective 40-day moving averages [DMAs]. It helps to identify extremes in market sentiment that are likely to reverse. To learn more about it, see my T2108 Resource Page. You can follow real-time T2108 commentary on twitter using the #T2108 hashtag. T2108-related trades and other trades are occasionally posted on twitter using the #120trade hashtag. T2107 measures the percentage of stocks trading above their respective 200DMAs)
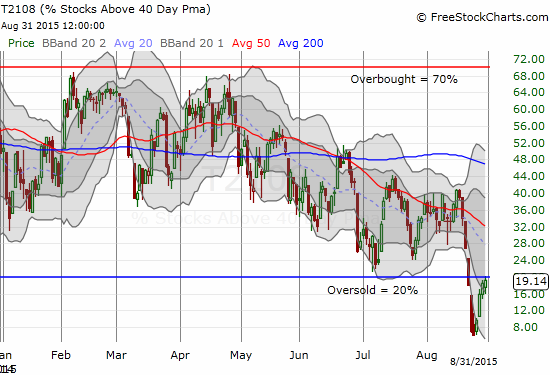
T2108 Status: 19.1% (briefly exited oversold period with a high of 20.3%)
T2107 Status: 23.7%
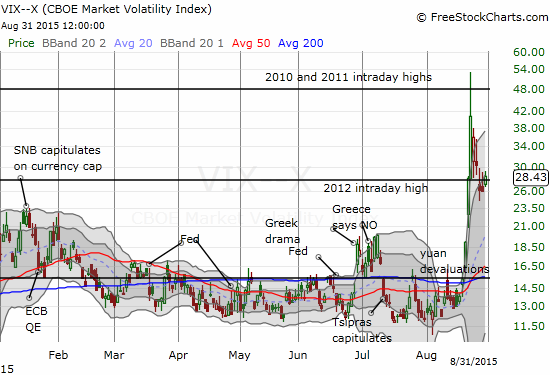
VIX Status: 28.4
General (Short-term) Trading Call: Bullish
Active T2108 periods: Day #7 below 20% (oversold), Day #8 under 30%, Day #31 under 40%, Day #71 under 50%, Day #88 under 60%, Day #286 under 70%
Reference Charts (click for view of last 6 months from Stockcharts.com):
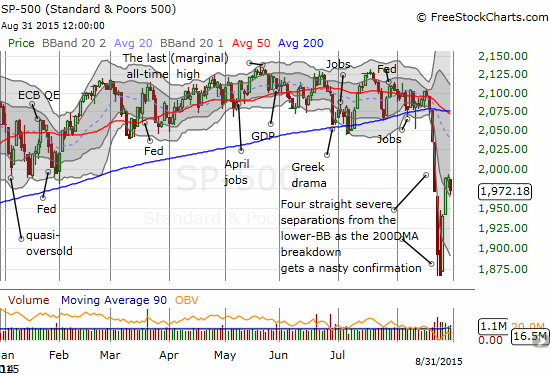
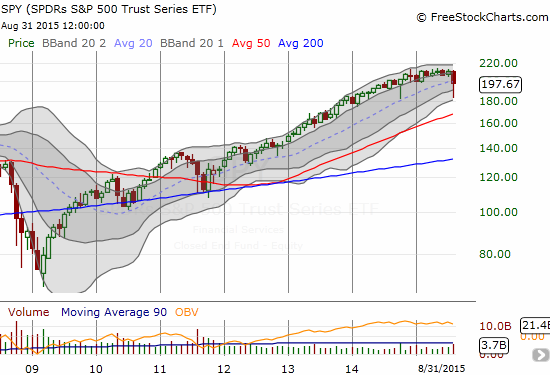
S&P 500 or SPY
SDS (ProShares UltraShort S&P500)
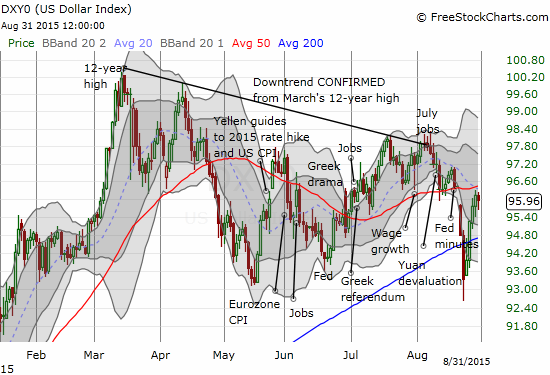
U.S. Dollar Index (volatility index)
EEM (iShares MSCI Emerging Markets)
VIX (volatility index)
VXX (iPath S&P 500 VIX Short-Term Futures ETN)
EWG (iShares MSCI Germany Index Fund)
CAT (Caterpillar).
Commentary
T2108 made an effort to end the oversold period at six days, but my favorite technical indicator could not quite close the deal. After reaching a high of 20.3%, T2108 fell back to close at 19.1%.
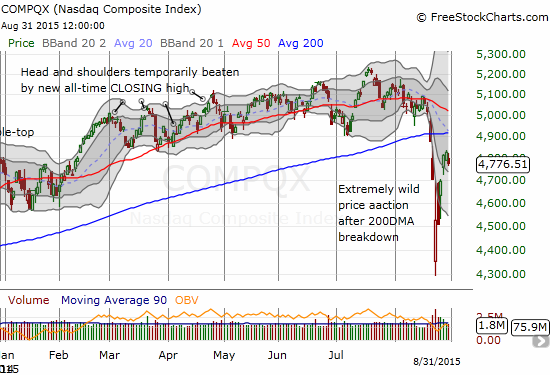
It was a strange day for T2108 to make a run at ending the oversold period. The S&P 500 (SPY) was never up for the day and closed down 0.8%. Ditto for the NASDAQ (QQQ).
The volatility index, the VIX, gained a healthy 9.1% that seemed well in excess of the small downtick on the S&P 500. The close at 28.4 puts the VIX back into the dangerzone and primed for more upside. Following the T2108 trading strategy I have discussed in several earlier posts, less aggressive traders/investors should stand down here and wait out the action. Aggressive traders following the T2108 trading strategy should get primed for another round of trades if the VIX manages to challenge the high printed last week. I will get extremely aggressive if the VIX somehow breaks through that high. I know a double from here seems impossible, but last week’s massive sell-off and subsequent massive bounce also seemed impossible just two weeks ago.
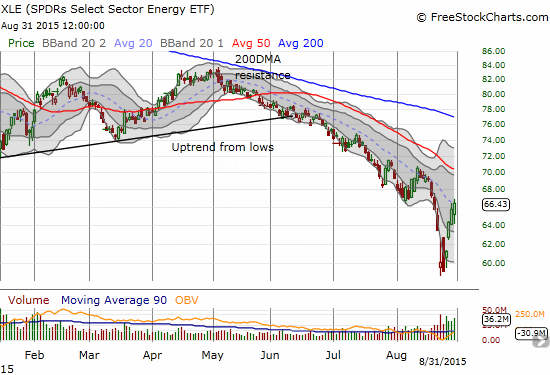
So how did T2108 manage to rally with BOTH major indices taking notable breathers? It had to be the commodity complex led by another surge in oil. The United States Oil ETF (USO) gained an impressive 6.8% for a third straight day of massive gains. The Energy Select Sector SPDR ETF (XLE) has enjoyed the ride. XLE gained 1.0% on the day.
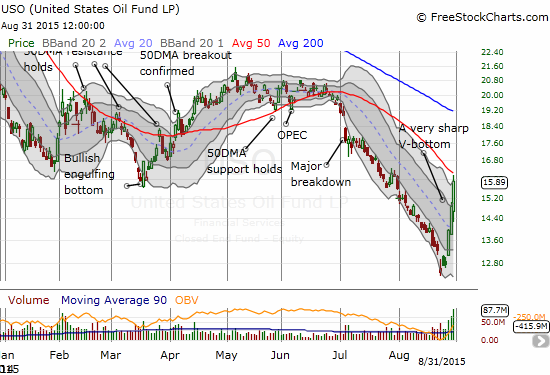
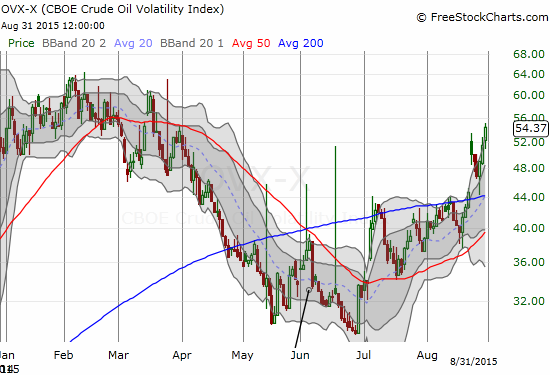
I am really disappointed I missed an opportunity to double up on my rangebound bet on USO before this rally. However, my opportunity may come again soon. Not only is USO bumping up against its 50DMA overhead resistance and downwtrend, but also the volatility measure for USO, the CBOE Crude Oil Volatility Index, or OVX, jumped another 5.4%. OVX has risen on each of USO’s rally days. I THINK this counter-intuitive action warns us to expect significant downside in USO right around the corner. I am watching this one extra-closely now. Assuming USO backs down again, I am targeting about a 50% retracement of the current three days of gains.
Not even the bounceback in the U.S. dollar has slowed USO down.
From here, the countdown to the Federal Reserve’s highly anticipated September meeting begins in earnest…with a stop along the way at the vista point of the jobs report this Friday. Traders should not expect the market to make any progress up or down until the Fed has its say. The resulting churn and chop should frustrated bears and bulls but provide some choice trading opportunities for alert traders. Today’s strange action between the major indices, the VIX, and T2108 is probably an early sign of what is to become commonplace for the next two weeks.
Today was a relatively calm day for my own trades given the lack of definitive signals. Here are the two most notable: 1) I accumulated more Direxion Daily Russia Bear 3X ETF (RUSS) even as I was disappointed by the wide swing from a healthy gain to a healthy loss on the day; 2) a lowball limit order on Netflix (NFLX) call options triggered as the stock took a dip to a 3% loss late in the day.
Daily T2108 vs the S&P 500
")
Black line: T2108 (measured on the right); Green line: S&P 500 (for comparative purposes)
Red line: T2108 Overbought (70%); Blue line: T2108 Oversold (20%)
Weekly T2108

*All charts created using freestockcharts.com unless otherwise stated
The charts above are the my LATEST updates independent of the date of this given T2108 post. For my latest T2108 post click here.
Related links:
The T2108 Resource Page
Expanded daily chart of T2108 versus the S&P 500
Expanded weekly chart of T2108
Be careful out there!
Full disclosure: long SVXY shares, long SSO shares and call options, long RUSS, long NFLX call options, short USO call spread, short USO put options, long and short various currencies against the U.S. dollar