(T2108 measures the percentage of stocks trading above their respective 40-day moving averages [DMAs]. To learn more about it, see my T2108 Resource Page. You can follow real-time T2108 commentary on twitter using the #T2108 hashtag.)
T2108 Status: 27% (The FIRST day out of an historic oversold period that lasted 17 days – 3rd longest since 1987).
VIX Status: 32
General (Short-term) Trading Call: Hold
Commentary
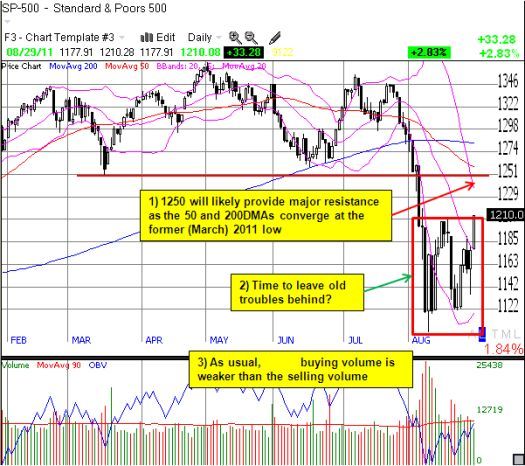
What a pleasant surprise. On Friday, I was thinking that the market would remain stymied by the 20DMA and the 20% oversold threshold. Neither held, as T2108 finally bolted out of oversold territory after spending a historic 17 days mired in oversold conditions. Moreover, the S&P 500 broke above key resistance levels; I was expecting a rally like today’s 3% pop on the S&P 500 to wait until the first of September. The index is now trying to leave behind a tangled and twisted mess of angst and churn, but it will quickly need to deal with overhead resistance from the now declining 50DMA and flattening 200DMA.

One of the tests for success in playing oversold conditions is to compare the maximum downdraft (risk) with the return on the first day post-oversold (initial reward). On August 4, the S&P 500 fell 5% to close at 1200 and first entered oversold territory. The index hit rock bottom 5 days later on an intra-day basis at 1101 for an 8.3% maximum drawdown. The conservative trader waited until close to the low of the next day as the VIX (the volatility index) quickly surged 20% above the previous day’s high. The low on August 5 was 1168, and assuming the conservative trader was quick and nimble that day (not likely), s/he suffered a maximum drawdown of 5.7%. With the S&P 500 closing at 1210, the aggressive trader so far has little to show for all that risk UNLESS s/he followed my advice to add to positions. The conservative trader has a more attractive, but still tiny, return of 2.8%. This poor risk/reward on the first day out of oversold territory is not a surprise given the extreme and historic nature of this sell-off. I am expecting some extremes on the positive side to follow eventually.
The best outcome so far is that no one following T2108 panicked and dumped entire portfolios during the oversold period, thus saving a lot of grief and unnecessary loss. (Note well that the rules to sell trading positions on a break of the 1101 low included a rule to buy back into the market well before the oversold period ended and to maintain short positions).
So, surviving the oversold period was the “easy” part. As I have mentioned before (prematurely as it turned out!), constructing an exit strategy after the oversold period ends represents a bigger mental challenge. I have no set rules. Given the virulence of this sell-off, I think caution remains warranted. Locking in some profits makes a lot of sense, especially to provide stamina if the market suddenly dips back into oversold territory (I am expecting a retest of overhead resistance first). I sold some of my long SSO position and intend to evaluate further sales on a day-by-day basis. I still have not closed out the few shorts and puts that I have. My ultimate target is to wait on overbought conditions to return and/or a retest of the overhead resistance shown above. I think the S&P 500 hits overhead resistance well before T2108 gets overbought, even with most 40DMAs in decline now. (For details on related trades see my twitter feed and/or search for the #120trade hashtag.)
I have switched the trading call to “hold” primarily to reflect the end of a period where buying on the dips appeared to hold large rewards relative to risk. Traders should use very careful discretion in new bullish trades given today’s technical discussion.
Finally, the VIX appears just about ready to validate a sustained rally. It dropped 9% and is testing the levels from the last local peak in the S&P 500. A close below 30.8 or so, should grease the skids for the VIX. With these expectations, I am maintaining my put positions on VXX here. (Click preceding links for current charts.)
Charts below are the latest snapshots of T2108 (and the S&P 500)
Refresh browser if the charts are the same as the last T2108 update.
Daily T2108 vs the S&P 500

Black line: T2108 (measured on the right); Red line: S&P 500 (for comparative purposes)
Weekly T2108

*All charts created using TeleChart:

Related links:
The T2108 Resource Page
Expanded daily chart of T2108 versus the S&P 500
Expanded weekly chart of T2108
Be careful out there!
Full disclosure: long shares and calls on SSO, long VXX puts
