
(T2108 measures the percentage of stocks trading above their respective 40-day moving averages [DMAs]. It helps to identify extremes in market sentiment that are likely to reverse. To learn more about it, see my T2108 Resource Page. You can follow real-time T2108 commentary on twitter using the #T2108 hashtag. T2108-related trades and other trades are occasionally posted on twitter using the #120trade hashtag. T2107 measures the percentage of stocks trading above their respective 200DMAs)
T2108 Status: 18.5%
T2107 Status: 24.1%
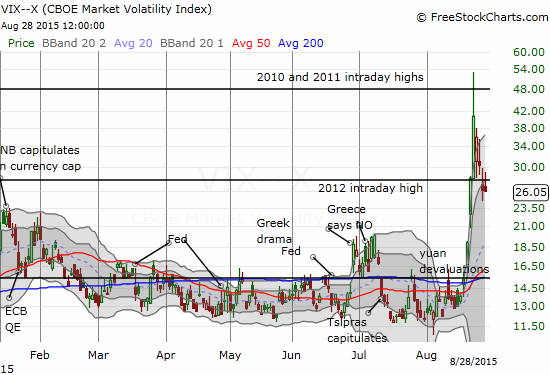
VIX Status: 26.1
General (Short-term) Trading Call: Bullish
Active T2108 periods: Day #6 below 20% (oversold), Day #7 under 30%, Day #30 under 40%, Day #70 under 50%, Day #87 under 60%, Day #285 under 70%
Reference Charts (click for view of last 6 months from Stockcharts.com):
S&P 500 or SPY
SDS (ProShares UltraShort S&P500)
U.S. Dollar Index (volatility index)
EEM (iShares MSCI Emerging Markets)
VIX (volatility index)
VXX (iPath S&P 500 VIX Short-Term Futures ETN)
EWG (iShares MSCI Germany Index Fund)
CAT (Caterpillar).
Commentary
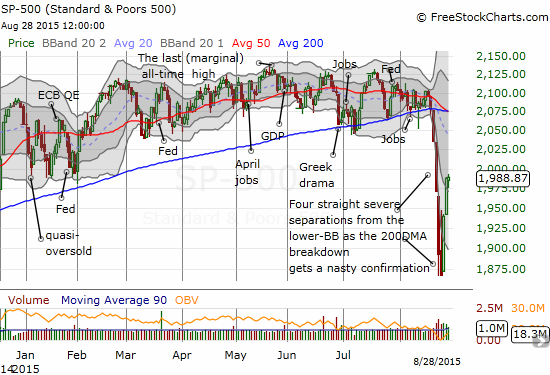
Did the S&P 500 (SPY) really close the week with a 0.9% gain? If you were not paying any attention to the market, you might mistakenly think all is well and normal, just another sleepy week of summer.
T2108 also made a complete recovery with a close at 18.5%, right in line with last week’s 18.1% close. T2108 even made a run at ending the oversold period when it got as high as 19.4%.
The volatility index, the VIX, stayed essentially flat from Thursday’s close and closed below the previous week’s close. The VIX remains in a position for less aggressive traders to make T2108 oversold buys with the caveats I mentioned in the last T2108 Update.
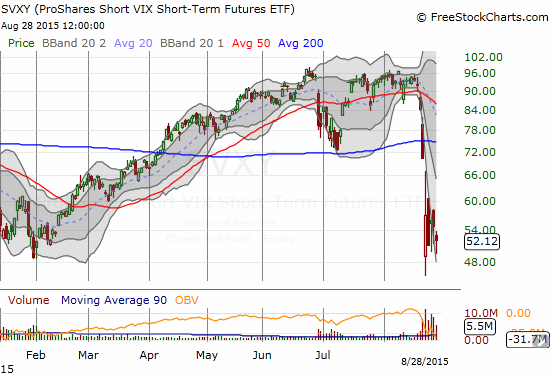
Strangely, the ProShares Short VIX Short-Term Futures (SVXY) lost a sizable 4.9% despite the flat close of the VIX. Once again, the 51 level provided modest support for SVXY. This time I decided to dive in with another short-term trade (meaning this supplements the SVXY shares I have accumulated as a part of the T2108 oversold aggressive trading strategy).
Order is far from restored in the world of currencies. Reversals of last week’s chaos are still underway. My best tell, the Australian dollar (FXA) versus the Japanese yen (FXY), aka AUD/JPY, closed the week on a strong note after early weakness on Friday. It still has a ways to go return to the previous week’s close around 89.33.
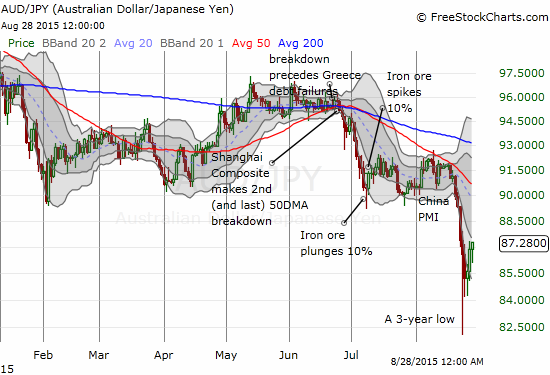
The gap that remains for AUD/JPY to the previous week’s close likely represents the upside opportunity for the S&P 500 in the coming week. The coming week will end with the last jobs report before the much anticipated September 16-17 Federal Reserve meeting. The Fed collectively in the past few days has done its best to both reassure markets and add no new net information. In case you were wondering, the odds for a September hike remain extremely low by the market’s estimation. The market is just barely willing to believe there will be ANY rate hike this year.
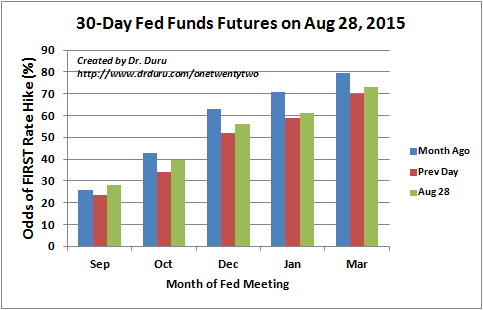
Source: CME Group FedWatch
(Note for the previous day’s odds, I had to use numbers I recorded the previous day. The CME still has issues properly updating its table. Also nte that I have been told these values are updated at 8am Eastern and NOT at the close of trading).
Volatility should remain elevated at least through the September jobs report if not all the way through to the September Fed meeting. As such, I am prepared for T2108 to exit the current oversold period only to return, say, after Labor Day when the really big money supposedly returns to the market (and probably ready to sell after getting spooked by the severe trading action of this oversold period!).
If the VIX is STILL elevated ahead of the Fed meeting, I will likely put on a pretty substantial bet to fade volatility. Stay tuned on that one as the nature of the bet will strongly depend on T2108 conditions; oversold conditions would be an ideal context for fading volatility ahead of the Fed meeting.
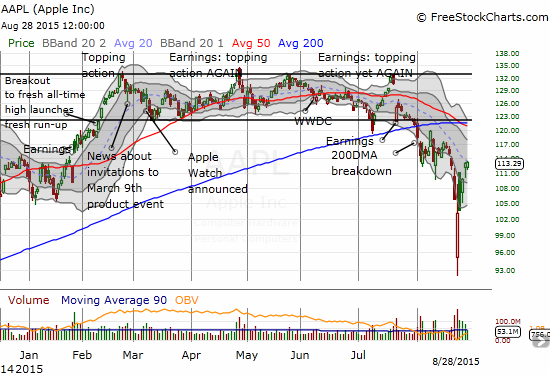
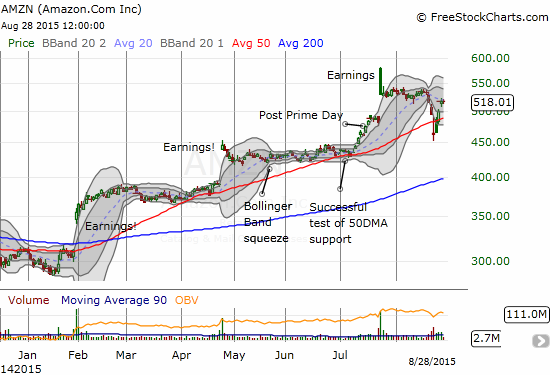
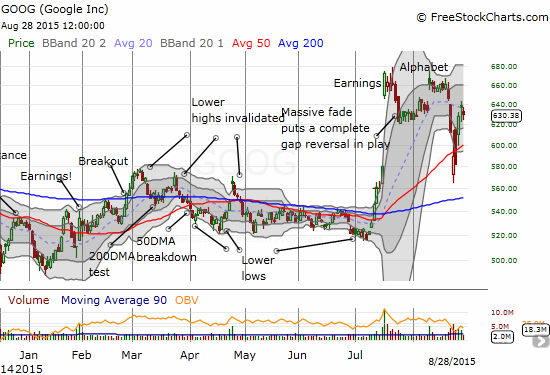
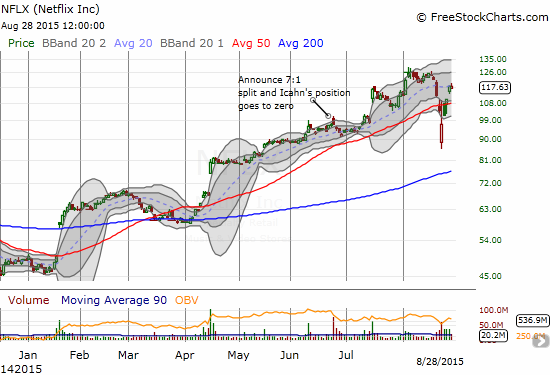
The strength of the market’s leaders has become one the most important features of the rally off oversold lows. The big tech giants for the most part stepped up and helped lead the way higher. While the S&P 500 is underwater year-to-date by 3.4%, these leaders are all still sitting on gains for the year. In most cases, these stocks have very comfortable year-to-date gains along with good technical positions. All but one has COMPLETELY reversed its losses from the oversold period which began with the previous Friday’s close. I think these charts speak for themselves: Apple (AAPL), Amazon.com (AMZN), Netflix (NFLX), and Google (GOOG). There is a near poetic symmetry in the positioning of these stocks that you just could not make up even if you tried. For all these stocks it is almost like nothing happened last week. Investors and traders clearly rushed for the relative “safety” of these names almost on reflex.
As an on-going feature for this oversold period, I am providing a quick summary of my key trades. I hope this helps those of you who are new to the T2108 trading strategy understand my approach and trigger some ideas for trades as the market churns through this chaotic period. These are also great notes for me and have served me very well to stay grounded.
- Sold SanDisk (SNDK) reluctantly. After hitting a new high for the bounce off lows, SNDK faded enough to take out my trailing stop. This was a high risk trade bought with shares. I was fortunate not to let myself get stopped out for a loss earlier in the week!
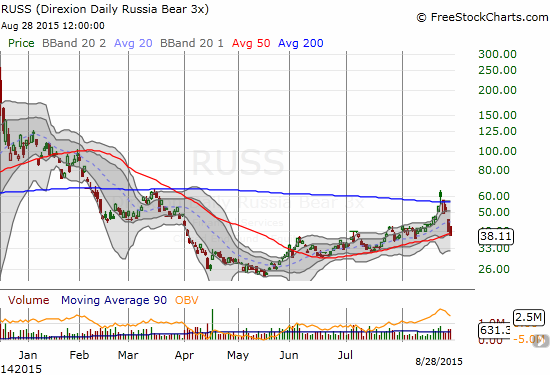
- Bought shares in Direxion Daily Russia Bear 3X ETF (RUSS). This is a bit of a hedge that is also a play on RUSS’s rising uptrend. See chart below.
- Sold a put option short in Twitter (TWTR). I will explain this trade in another post.
- As explained earlier, bought a new tranche of short-term shares in SVXY.
- Sold call options on Facebook (FB). FB is back to 50DMA resistance so this is a good spot to lock in the profits.
- Bought call options on Solar City (SCTY). I thought I had missed the trade I mapped out earlier. A fade into the close gave me a much better entry point.
- While I was able to flip a good number of positions for substantial profits in the oversold period (as chronicled in earlier posts), I did have to wave goodbye to a few positions that expired worthless. Some of htese were in names that delivered profits with better timed positioning. Call options on ProShares Ultra S&P500 (SSO), Disney (DIS) {I never did get in on the January, 2017 $110 call option as part of a strategy I outlined earlier. It is top of my list for the next sell-off if it comes}, iShares Nasdaq Biotechnology (IBB), Workday (WDAY); put options on ProShares Ultra VIX Short-Term Futures (UVXY).
Finally, just so we are all on the same page that something major DID happen, here is a very handy chart from Bloomberg that outlines the major events surrounding the implosion of the Shanghai Composite (SSEC). The Chinese government finally stopped defending the 200DMA last week. Perhaps it was NO coincidence that the 200DMA breakdown for the SSEC on Friday, August 21 happened ahead of the S&P 500’s plunge into oversold conditions. The S&P 500 broke down below its 200DMA the day before.
Click for a larger image…

Source: Bloomberg
Daily T2108 vs the S&P 500
")
Black line: T2108 (measured on the right); Green line: S&P 500 (for comparative purposes)
Red line: T2108 Overbought (70%); Blue line: T2108 Oversold (20%)
Weekly T2108

*All charts created using freestockcharts.com unless otherwise stated
The charts above are the my LATEST updates independent of the date of this given T2108 post. For my latest T2108 post click here.
Related links:
The T2108 Resource Page
Expanded daily chart of T2108 versus the S&P 500
Expanded weekly chart of T2108
Be careful out there!
Full disclosure: long SVXY shares, long SSO shares and call options, short AUD/JPY, long RUSS, long AAPL put spread, short TWTR put option and long call spread, short FB, long SCTY call option, long DIS call options, long UVXY put options