
The solar industry has taken an extra hard beating in the wake of the market’s general sell-off. Solar City (SCTY) has caught my interest because the stock has exhibited a clear pattern during this sell-off: a pivot around the 2014 low.
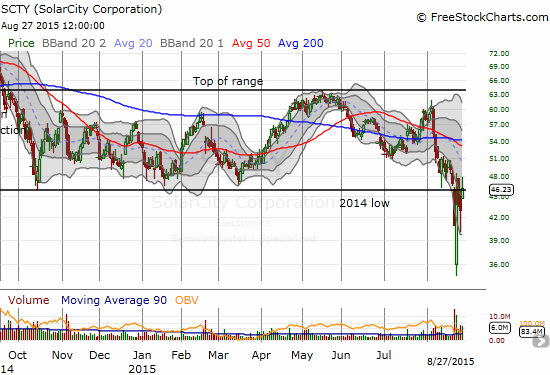
Solar City’s primary trading range extended back to late 2014. If I could extend the chart backward in a neat way, I could also show how SCTY experienced what now looks like two brief spurts above this same trading range. Under this looser definition, SCTY’s trading range goes all the way back to late 2013. The duration and durability of this trading range heightens the importance of the current breakdown.
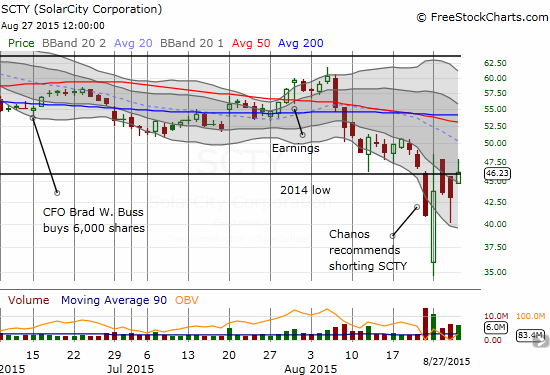
The chart below shows a close-up of this breakdown.
Source for charts: FreeStockCharts.com
Note well how the 2014 low has served well as a pivot. On August 12, SCTY made a very neat bounce directly off the 2014 low. At the time, the move looked like a promising bottom in the making. The warning began the very next day as SCTY failed to print any buying follow-through. The stock drifted lower for 6 trading days as the downward channel defined by the two lower-Bollinger Bands (BB) guided SCTY. As a result, last Friday’s major market sell-off found SCTY extremely vulnerable. SCTY made a clean break below the trading range for the first time since November, 2013. Selling volume had not been that high since November, 2014. This was a serious technical breakdown.
The good news for SCTY is that the stock has not CLOSED any lower since that day. The bad news for SCTY is that two attempts to close above the 2014 low were effectively faded by sellers.
This trading action turns the 2014 low into a very important pivot line. IF SCTY makes a new closing low in this cycle, traders should assume a lot more downside lies ahead. IF SCTY can manage to close above the pivot line AND next show at least one more higher close, preferably on strong buying volume, then traders should assume SCTY has primed itself to rally. The first upside target rests at overhead resistance from the downward sloping 50 and 200-day moving averages (DMA). The very bullish target rests at the top of the former trading range.
Adding to the intrigue was a well-reasoned buy rating from Morgan Stanley analyst Stephen Boyd. Boyd set a $93 rice target which is WELL above SCTY’s trading range. He even defended SCTY against short-seller Jim Chanos who recommended shorting SCTY on August 21st on CNBC. Chanos has a LOT of company: 44% of SCTY’s float is sold short! Talk about a potential powder keg…
Be careful out there!
Full disclosure: no positions