
(T2108 measures the percentage of stocks trading above their respective 40-day moving averages [DMAs]. It helps to identify extremes in market sentiment that are likely to reverse. To learn more about it, see my T2108 Resource Page. You can follow real-time T2108 commentary on twitter using the #T2108 hashtag. T2108-related trades and other trades are occasionally posted on twitter using the #120trade hashtag. T2107 measures the percentage of stocks trading above their respective 200DMAs)
T2108 Status: 37.5%
T2107 Status: 48.0%
VIX Status: 13.8
General (Short-term) Trading Call: Neutral.
Active T2108 periods: Day #153 over 20%, Day #112 above 30%, Day #1 under 40% (underperiod, ended 1 day above 40%), Day #5 under 50%, Day #23 under 60%, Day #222 under 70%
Reference Charts (click for view of last 6 months from Stockcharts.com):
S&P 500 or SPY
SDS (ProShares UltraShort S&P500)
U.S. Dollar Index (volatility index)
EEM (iShares MSCI Emerging Markets)
VIX (volatility index)
VXX (iPath S&P 500 VIX Short-Term Futures ETN)
EWG (iShares MSCI Germany Index Fund)
CAT (Caterpillar).
Commentary
The S&P 500 (SPY) lunged once again toward its 50DMA pivot point. The index continues to deliver on chop-chop behavior with an upward bias.
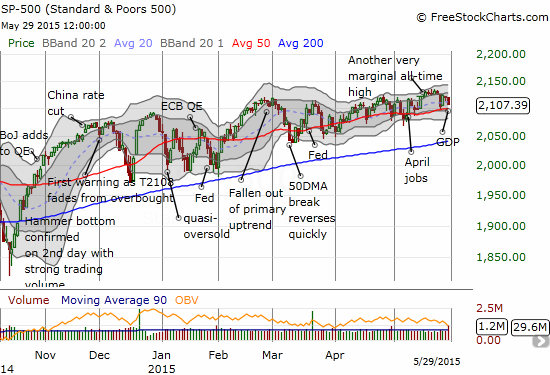
While the pivot point held as support for the S&P 500, the real news rests with T2108. T2108 plunged again and lost 5 percentage points for a 12% loss. T2108 traded as low as 35% before closing at 37%. T2108 is now trading back to levels last seen in January. In 2015, the 30% range has been as good as it gets for an “oversold” reading, so I fully expect the S&P 500 to spring to life once again on Monday.
Given the lows on T2108, I took a quick look at T2107, the percentage of stocks trading above their respective 200DMAs. This indicator of longer-term health has definitely lost its primary uptrend and is starting to look “tired.” May’s rebound failed to make a new high; it just takes a new low (below May’s low) to turn the bias to the downside. This is one small crack appearing amid the overall chop in the market.
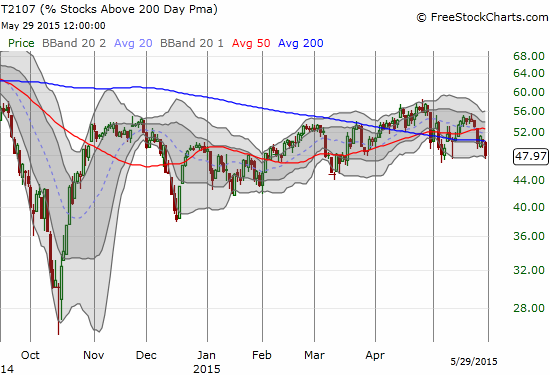
If T2107 weakens further, I will finally change my trading bias from neutral and go to bearish. Given the S&P 500’s chop, a bearish call would just mean fading rallies as we have little to indicate that the chop on the S&P 500 will stop anytime soon. In the meantime, I am still betting on a rally for volatility with call options on ProShares Ultra VIX Short-Term Futures (UVXY). The volatility index made a small gain on Friday as UVXY has finally stopped making new all-time lows.
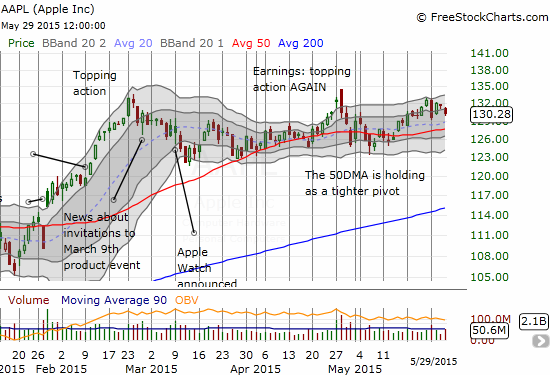
On the individual stock front, do not forget that coming up is the week before Apple’s Worldwide Developers Conference (WDC). As I explained in the May 26th T2108 Update, Apple (AAPL) tends to trade bullishly going into the conference, negatively during, and back to bullishly afterward. Friday’s drop to $130 set up a good entry point for the trade. There are two BIG caveats this year: 1) Ever since the all-time high in late February, AAPL has printed topping patterns. The implication is that upside for AAPL should be limited for the WWDC trade, likely around $135. 2) Ever since February’s top, AAPL has tended to gravitate toward its 50DMA. The implication is that AAPL has significant downside risk this week back to at least $127.50 despite any growing anticipation for the WWDC.
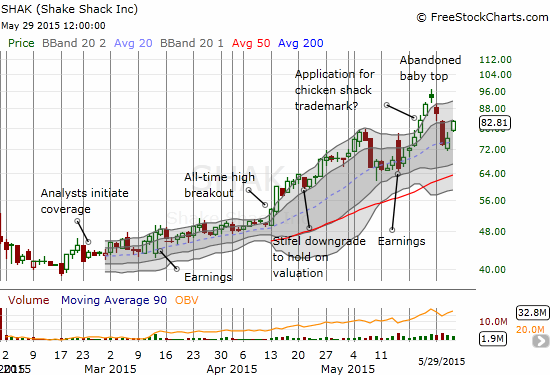
The watch on Shake Shack (SHAK) continues. As expected, SHAK rebounded from its sharp two-day loss. I described the trade in the last T2108 Update, but I was far from brave enough to buy the bounce…even during or after the first day of buying seemed to confirm my expectations. Now both bears and bulls will sit on pins and needles to see whether SHAK can follow-through on the renewed buying interest or find resistance at the first level recovery point. Until SHAK breaks through the topping pattern (a very bearish abandoned baby top), the outlook for SHAK remains bearish. However, it is impossible to bet against the stock with no options available for trade and now, according to my friend, margin interest for shorting the stock has increased further to 141%! Clearly, there is HUGE interest in betting against SHAK. As long as interest is this high, I cannot imagine shorts wanting to hold positions for a long time (thus my expectation for a bounce after that steep 2-day 21% loss). Bulls can find encouragement in SHAK’s ability to remain in positive post-earnings territory after a nasty fade the day following earnings.
Daily T2108 vs the S&P 500
")
Black line: T2108 (measured on the right); Green line: S&P 500 (for comparative purposes)
Red line: T2108 Overbought (70%); Blue line: T2108 Oversold (20%)
Weekly T2108

*All charts created using freestockcharts.com unless otherwise stated
The T2108 Resource Page
Expanded daily chart of T2108 versus the S&P 500
Expanded weekly chart of T2108
Be careful out there!
Full disclosure: long UVXY call options, long AAPL call options