
(T2108 measures the percentage of stocks trading above their respective 40-day moving averages [DMAs]. It helps to identify extremes in market sentiment that are likely to reverse. To learn more about it, see my T2108 Resource Page. You can follow real-time T2108 commentary on twitter using the #T2108 hashtag. T2108-related trades and other trades are occasionally posted on twitter using the #120trade hashtag. T2107 measures the percentage of stocks trading above their respective 200DMAs)
T2108 Status: 39.2% (a 11 percentage point plunge, a 2 1/2 month low, and the bottom of recent trading range)
T2107 Status: 50.0%
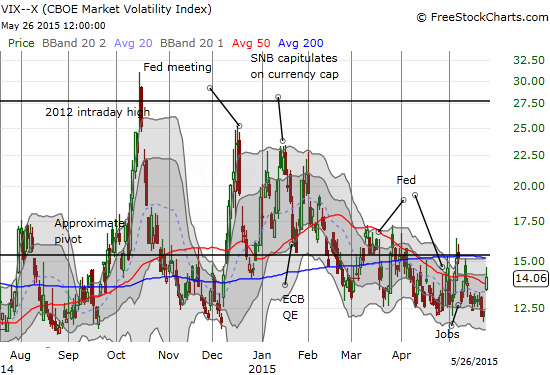
VIX Status: 14.1
General (Short-term) Trading Call: Neutral. See caveats below for slight bearish bias. Setup for S&P 500 run-up comes to a screeching halt.
Active T2108 periods: Day #150 over 20%, Day #109 above 30%, Day #1 under 40% (Friday ended 40-day overperiod at 51 days), Day #19 under 60%, Day #219 under 70%
Reference Charts (click for view of last 6 months from Stockcharts.com):
S&P 500 or SPY
SDS (ProShares UltraShort S&P500)
U.S. Dollar Index (volatility index)
EEM (iShares MSCI Emerging Markets)
VIX (volatility index)
VXX (iPath S&P 500 VIX Short-Term Futures ETN)
EWG (iShares MSCI Germany Index Fund)
CAT (Caterpillar).
Commentary
The U.S. dollar (UUP) was the major theme for the day. The index powered through its 50-day moving average (DMA) and set a fresh tone in the market.
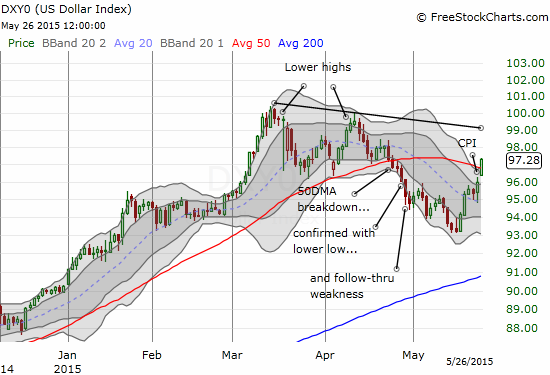
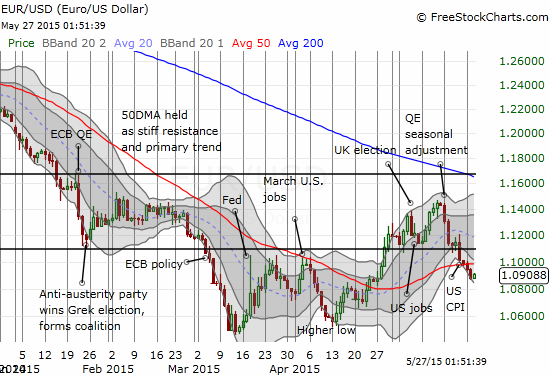
This surge in the dollar index was pent-up buying from the U.S. Memorial Day holiday on Monday where dollar momentum continued from Friday’s CPI print. A prime example came from the euro (FXE) which broke through 50DMA resistance on Monday. This breakdown unfolded much faster than I was imagining when I updated my trading outlook for the euro in “The Euro’s Latest Breakdown Takes It To the Edge of A Larger Sell-Off” and after I concluded that the market over-reacted to the U.S. CPI data.
Having Monday to ruminate on the currency moves, I decided to take a bearish bias on Tuesday’s trading action no matter how the market opened. The market gapped down slightly and almost never looked back. I had to work quickly at the open. By the time the smoke settled, T2108 closed with a massive plunge of 11 percentage points to 39.2%.
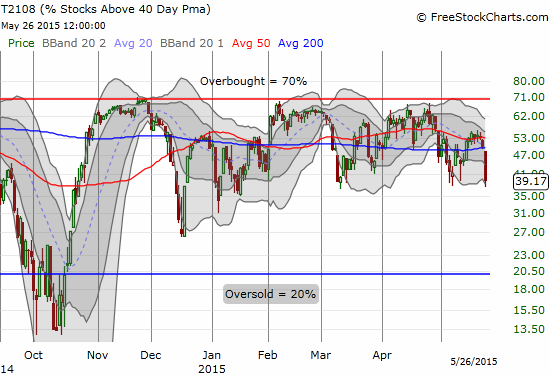
T2108 is sending some important signals, especially given the S&P 500 (SPY) “only” fell 1.0%.
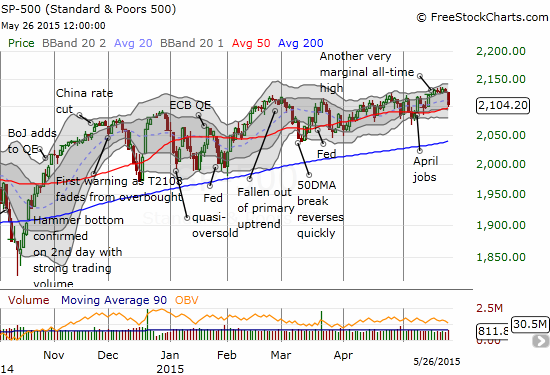
The marginal, gradual, yet choppy, rise in the market has apparently flattened out a lot of moving averages on individual stocks. This is the main way to explain how T2108 can drop so deeply on a simple 1% decline on the S&P 500 with 50DMA support intact. In other words, T2108 is extra sensitive to material moves in the stock market.
With T2108 at the bottom of its recent trading range (measuring from January) and the S&P 500 floating above its very reliable 50DMA support, conditions are setup for yet another bounce and chop upward to another marginal all-time high by July. Moreover, the numerous “pricks” of this 50DMA support since December suggest that another dip below the 50DMA will be temporary and deliver another buying opportunity for quick-handed traders. Working in the favor of such a trade should be a T2108 which would be ever closer to overbought and its low for the year. This catalyst becomes doubly powerful if the 200DMA gets retested: T2108 will certainly be at or beyond the oversold threshold by then.
Despite my Tuesday morning bearishness, I could not pull the trigger on ProShares Ultra S&P500 (SSO) put options. Instead, I grabbed a fresh tranche of call options on ProShares Ultra VIX Short-Term Futures (UVXY). I went out to the June monthly to accommodate the potential for a major volatility-positive event going into summer. With currency markets providing a notable wildcard, I think volatility is exposing a surprisingly high level of complacency.
I made two other notable bearish moves: put options on Apple (AAPL) and iShares Nasdaq Biotechnology (IBB).
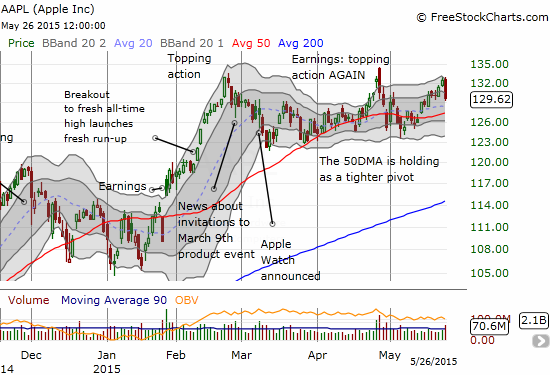
The move on AAPL turned into a daytrade as the drop in the stock proved sufficient to take a 2.5x gain on the puts. This gain excludes the small loss I have on a single call option I bought as a potential play on the tendency for AAPL to rally into the Worldwide Developers Conference. I plan to accumulate a position at least one more time this week. This year’s WWDC runs from June 8 to 12. The short-term bearishness on AAPL was accentuated by the stock’s distance from its 50DMA. Last week, AAPL managed to rally right to the top of its upper-Bollinger Band, short of a new all-time high, and right at presumed resistance formed by two topping patterns – I only needed to see the first sign of wavering at the open. I did not bother running the Apple Trading Model for this trade (I decided a while back to just play the 50DMA pivot).
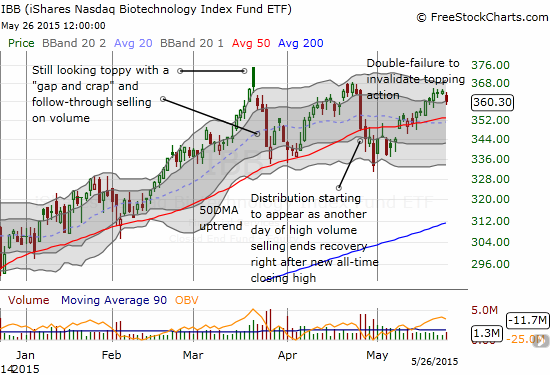
I wrote previously about the bearish distribution pattern showing up on iShares Nasdaq Biotechnology (IBB). This bearishness was beaten back once IBB managed to gap higher above its 50DMA. As of Friday, the comeback took IBB back to the marginal all-time high from April that did NOT invalidate the topping action from March (a gap and crap at all-time highs on high volume and confirmed by subsequent selling). So, given my bearish bias, it seemed like a good spot to try put options again on IBB. So far, so good. I imagine I cannot expect much downside past 50DMA support in the short-term.
Daily T2108 vs the S&P 500
")
Black line: T2108 (measured on the right); Green line: S&P 500 (for comparative purposes)
Red line: T2108 Overbought (70%); Blue line: T2108 Oversold (20%)
Weekly T2108

*All charts created using freestockcharts.com unless otherwise stated
The T2108 Resource Page
Expanded daily chart of T2108 versus the S&P 500
Expanded weekly chart of T2108
Be careful out there!
Full disclosure: long UVXY call options, short EUR/USD (net short the U.S. dollar), long an AAPL call option, long IBB put options