
(This is an excerpt from an article I originally published on Seeking Alpha on June 1, 2015. Click here to read the entire piece.)
OPEC (the Organization of the Petroleum Exporting Countries) meets this week on June 5th in a much different price environment for oil than the November, 2014 meeting. {snip}
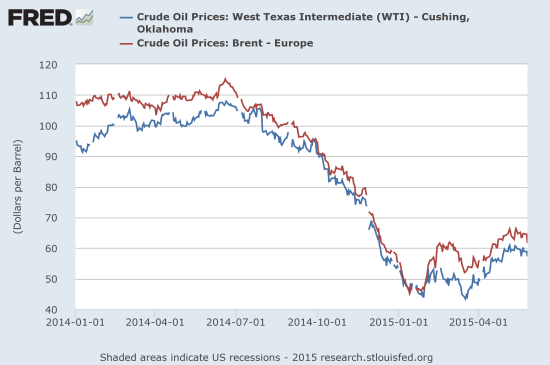
Sources: US. Energy Information Administration, Crude Oil Prices: West Texas Intermediate (WTI) – Cushing, Oklahoma [DCOILWTICO], retrieved from FRED, Federal Reserve Bank of St. Louis, May 30, 2015.
US. Energy Information Administration, Crude Oil Prices: Brent – Europe [DCOILBRENTEU], retrieved from FRED, Federal Reserve Bank of St. Louis, May 30, 2015.
Going into that March low for WTI, I reported on a large options bet on the United States Oil ETF (USO) that Barron’s covered briefly. The options expire on January, 2017 and bet that USO will trade between $12.30/share and $25.70/share by expiration. With the upcoming OPEC meeting, I thought this would be a good time to check in on that bet. The following calculations cover prices from March 5, 2015 to May 29 for the call and put options expiring January, 2017.
$19 Call: $3.42 vs $3.97 = loss of $0.55 or 16%
$20 Call: $2.95 vs $3.40 = loss of $0.45 or 15%
$19 Put: $3.50 vs $2.45 = gain of $1.05 or 30%
$20 Put: $4.06 vs $2.90 = gain of $1.16 or 29%
{snip}
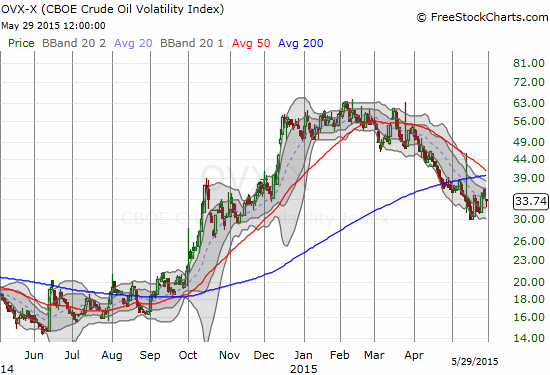
Source: FreeStockCharts.com
{snip}
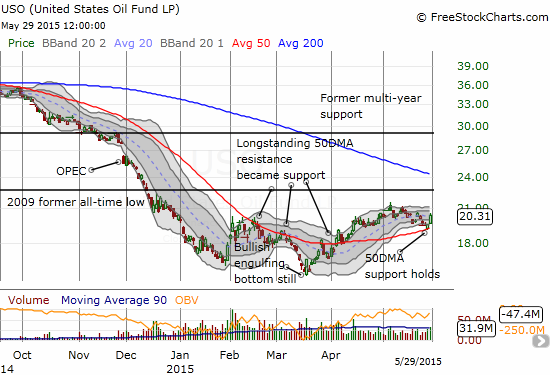
Source: FreeStockCharts.com
The USO chart shows that the ETF has neatly followed and delivered on several key technical signals. {snip}
Be careful out there!
Full disclosure: long USO put options
(This is an excerpt from an article I originally published on Seeking Alpha on June 1, 2015. Click here to read the entire piece.)