
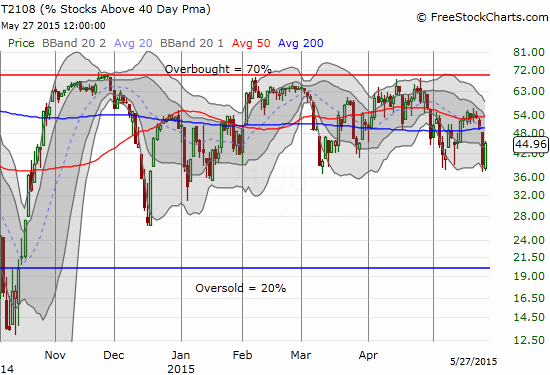
(T2108 measures the percentage of stocks trading above their respective 40-day moving averages [DMAs]. It helps to identify extremes in market sentiment that are likely to reverse. To learn more about it, see my T2108 Resource Page. You can follow real-time T2108 commentary on twitter using the #T2108 hashtag. T2108-related trades and other trades are occasionally posted on twitter using the #120trade hashtag. T2107 measures the percentage of stocks trading above their respective 200DMAs)
T2108 Status: 45.0%
T2107 Status: 51.3%
VIX Status: 13.3
General (Short-term) Trading Call: Neutral.
Active T2108 periods: Day #151 over 20%, Day #110 above 30%, Day #1 above 40% (overperiod, ended 1 day below 40%), Day #3 under 50% (underperiod), Day #21 under 60%, Day #220 under 70%
Reference Charts (click for view of last 6 months from Stockcharts.com):
S&P 500 or SPY
SDS (ProShares UltraShort S&P500)
U.S. Dollar Index (volatility index)
EEM (iShares MSCI Emerging Markets)
VIX (volatility index)
VXX (iPath S&P 500 VIX Short-Term Futures ETN)
EWG (iShares MSCI Germany Index Fund)
CAT (Caterpillar).
Commentary
Today delivered a great example of how the stock market does NOT respond the moves in the U.S. dollar index (UUP). The U.S. dollar ended the day flat, yet the S&P 500 (SPY) was still able to recover most of its losses from Tuesday. On that day, the surge in the dollar was supposedly responsible (or at least correlated with) the plunge in the stock market. It stands to reason that mainly dollar weakness could return the S&P 500 to the previous level.
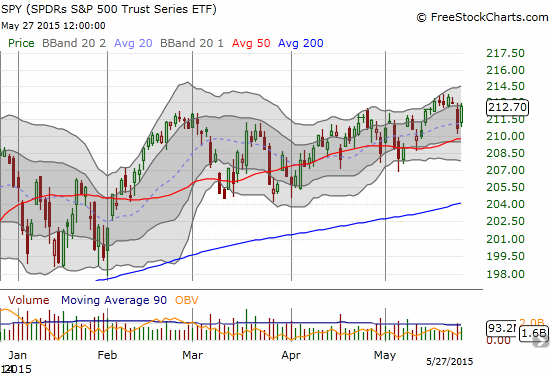
T2108 also bounced sharped but did NOT recover all its loss.
Of course, this bounce also reversed my gains from the previous day’s trade on volatility. Interestingly, the volatility index, the VIX, only lost about half its previous loss. So it is still very possible that the path going forward is higher volatility.
If the currency market has anything to say about volatility, recent gyrations are telling me that the waters are getting rougher. Attracting my attention bigtime is the sudden renewed weakness in the Japanese yen (FXY). Presumably, yen weakness is still considered bullish for carry trades that support asset markets. However, the sudden reawakening does not seem to have a palpable catalyst.
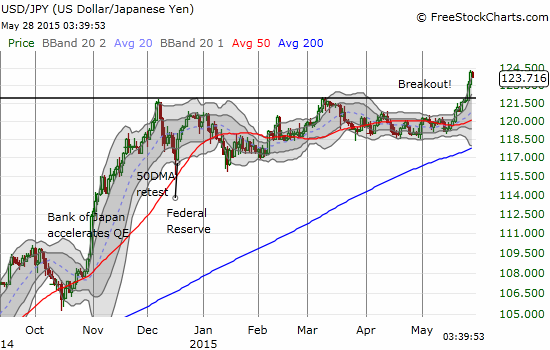
I am seeing other jitters in the currency market with sharp lefts and rights happening without warning or palpable catalyst. We only really have follow-through to last week’s U.S. Consumer Price Index (CPI) as a prime driver. So, even if the S&P 500 makes another one of its 2015 classic new marginal highs, I am sticking by the long-volatility trade as a way to stay prepared for “something” happening out of nowhere.
One stock that looks like an accident waiting to happen is Shake Shack (SHAK). Last Friday, it printed a classic topping pattern (a spinning top) that was confirmed by a gap down that has turned this pattern into an “abandoned baby top.”
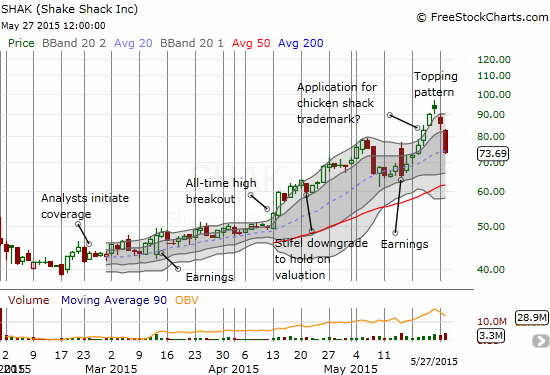
Over the weekend, a friend noted it was primed to fall, and I agreed with him.
Time to short $SHAK ? Well above its upper Bollinger band & 100 s/be resistance http://t.co/wuNC74rTd1
— Michael Seneadza (@TraderMike) May 23, 2015
However, shorting looked too expensive ahead of knowing just how much SHAK would lose in short order. Unfortunately, the stock does not yet have options trading against it.
So Interactive Brokers is charging 121% interest to borrow Shake Shack ( $SHAK ) shares. I'll pass on *that* short idea.
— Michael Seneadza (@TraderMike) May 25, 2015
According to Yahoo! Finance, SHAK has 37% of its float sold short. So the bearish trade is already quite crowded (and right I think). Another friend wrote a great theme piece explaining how SHAK represents everything bad AND good about this market – see “Shake Shake Shake: The Shack Shack Metaphor.” Ironically, given the expense of staying short, I would not be surprised if SHAK rebounds soon as shorts look to lock in profits or take this opportunity to reduce losses ahead of getting charged more exorbitant margin rates.
Daily T2108 vs the S&P 500
")
Black line: T2108 (measured on the right); Green line: S&P 500 (for comparative purposes)
Red line: T2108 Overbought (70%); Blue line: T2108 Oversold (20%)
Weekly T2108

*All charts created using freestockcharts.com unless otherwise stated
The T2108 Resource Page
Expanded daily chart of T2108 versus the S&P 500
Expanded weekly chart of T2108
Be careful out there!
Full disclosure: long UVXY call options, short EUR/USD (net short the U.S. dollar), long an AAPL call option, long IBB put options