
(This is an excerpt from an article I originally published on Seeking Alpha on March 16, 2015. Click here to read the entire piece.)
On March 5, 2015, Barron’s Blogs published a short article on a large bet against volatility on United States Oil ETF (USO) called “Big Options Bet Sees Oil ETF Rangebound into 2017.” {snip}
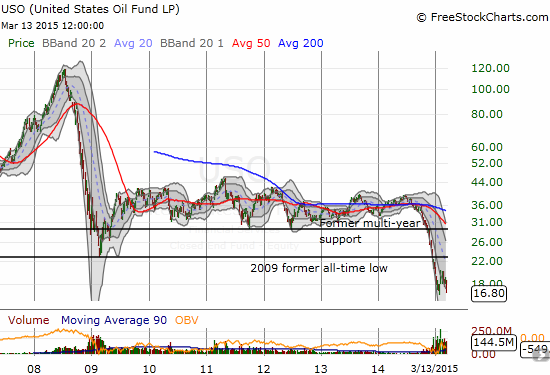
Source: FreeStockCharts.com
Directionless, long-term bets seem very reasonable especially given the runway allowed to close-out the trade at a profit well ahead of expiration.
{snip}
The Barron’s blog indicated that the big trade will work as long as USO remains within the range of $12.30/share to $25.70/share. It did not provide the specific strikes, so I directly reviewed the Jan 2017 strikes for large increases in open interest. After this process, I concluded that the swell of negative short-term bets combined with the dispersion of opinion on longer-term bets makes a directionless bet more intriguing. {snip}
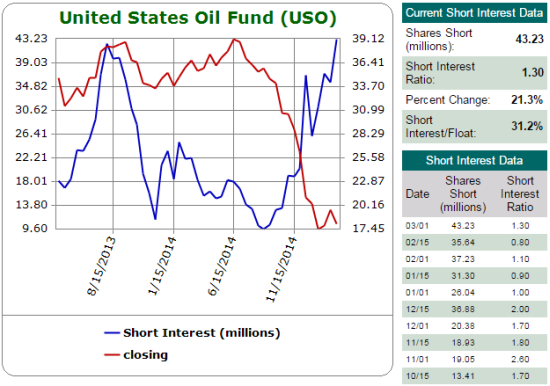
On a short-term basis, the opinion on USO is definitively negative although sentiment has hit even more negative levels before the big sell-off started. {snip}
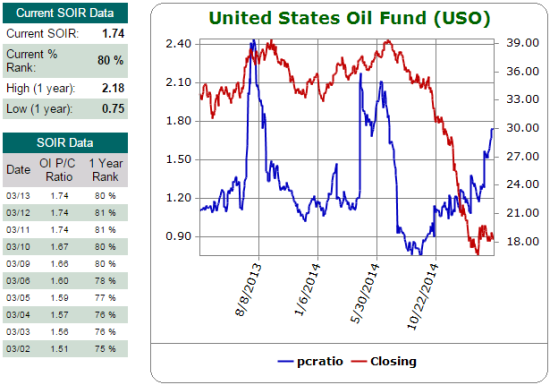
Source: Schaeffer’s Investment Research
In other words, the market only recently started to accept the bearish nature of the trading in USO as a result of the bearish fundamentals…{snip}
{snip}

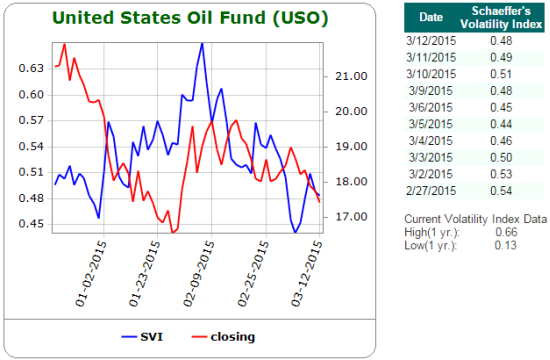
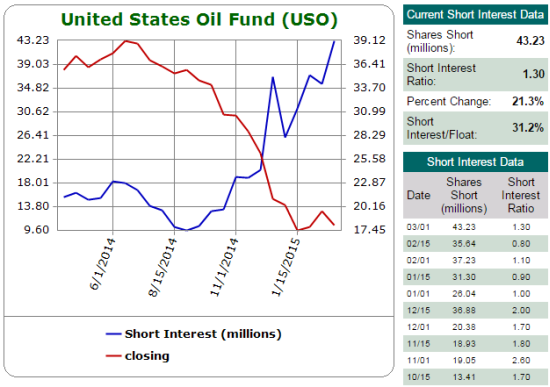
Source: Schaeffer’s Investment Research
The behavior of the SVI suggests that the market in USO is very reactive rather than predictive. {snip}
Like the open interest put/call ratio, it took the failure of OPEC’s November meeting to prop up prices for USO shorts to get really serious. {snip}
Source: Schaeffer’s Investment Research
{snip}
Source: Schaeffer’s Investment Research
{snip}
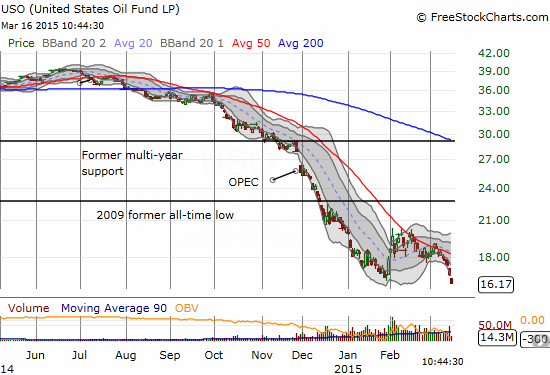
Source: FreeStockCharts.com
{snip}
Be careful out there!
Full disclosure: no positions
(This is an excerpt from an article I originally published on Seeking Alpha on March 16, 2015. Click here to read the entire piece.)