
(T2108 measures the percentage of stocks trading above their respective 40-day moving averages [DMAs]. It helps to identify extremes in market sentiment that are likely to reverse. To learn more about it, see my T2108 Resource Page. You can follow real-time T2108 commentary on twitter using the #T2108 hashtag. T2108-related trades and other trades are occasionally posted on twitter using the #120trade hashtag. T2107 measures the percentage of stocks trading above their respective 200DMAs)
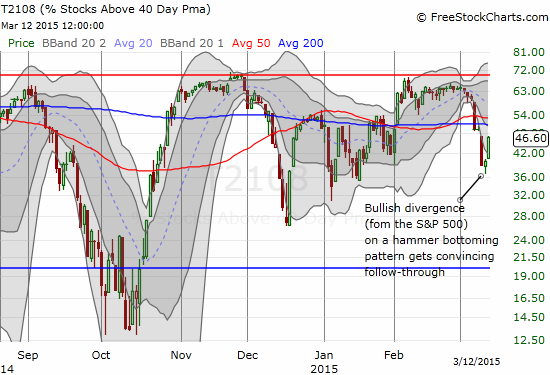
T2108 Status: 46.6%
T2107 Status: 48.1%
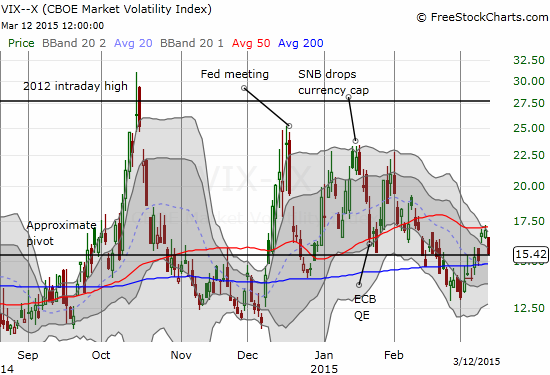
VIX Status: 15.4 (down 8.6%)
General (Short-term) Trading Call: Staying bearish until new all-time high or oversold. Fading rallies
Active T2108 periods: Day #99 over 20%, Day #58 above 30%, Day #2 above 40% (overperiod), Day #5 under 50%, Day #5 under 60%, Day #169 under 70%
Reference Charts (click for view of last 6 months from Stockcharts.com):
S&P 500 or SPY
SDS (ProShares UltraShort S&P500)
U.S. Dollar Index (volatility index)
EEM (iShares MSCI Emerging Markets)
VIX (volatility index)
VXX (iPath S&P 500 VIX Short-Term Futures ETN)
EWG (iShares MSCI Germany Index Fund)
CAT (Caterpillar).
Commentary
Sorry #T2108 followers. Didn't manage to post about bullish divergence with $SPY. Nice follow-thru today. Not expecting it to last tho
— Dr. Duru (@DrDuru) March 12, 2015
I did not want to believe it when I saw it Wednesday night, but there it was. A classic bullish divergence. I was startled to see that Wednesday’s close delivered a T2108 that surged strongly enough off its lows to close up over a point even as the S&P 500 (SPY) not only close down, but near its LOW for the day. I think this was one of the sharpest bullish divergences I have seen or at least that I can remember. The subsequent trading day delivered big-time.
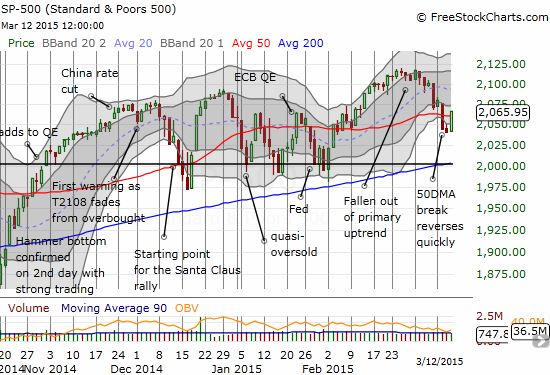
The rally today was so strong that the S&P 500 barely paused at 50DMA resistance and instead sliced right through it. This bullish behavior puts my T2108 call in a bind. Technically, this strong breakout should have me switching to full bullishness. However, the technical damage I was monitoring into the confirming selling was so convincing that I cannot easily change the trading call. As a compromise, I faded today’s rally as my last bearish move until/unless the S&P 500 breaks to a new low below 2040 or approaches overbought again. I faded by loading up on a second tranche of ProShares Ultra S&P500 (SSO) put options and restarting a tranche of call options on ProShares Ultra VIX Short-Term Futures (UVXY) as my play-the-Fed trade.
The UVXY put options could be particularly timely as the VIX fell back exactly to support at the 15.35 pivot (amazing how this line continues to act as a magnet). Even if the pivot fails to act as support, I am guessing the VIx will not crack the March lows. However, time is ticking. I am still expecting volatility to increase going into the Fed meeting next week.
I noticed that the mainstream media was at a loss to explain Thursday’s rally. It was truly one of those things that appeared to come out of nowhere. Not to mention that retail sales fell for the third month in a row. While I can refer to the bullish divergence between T2108 and the S&P 500, there was also a potential connection to the currency market…one that I happened to watch unfold in real time.
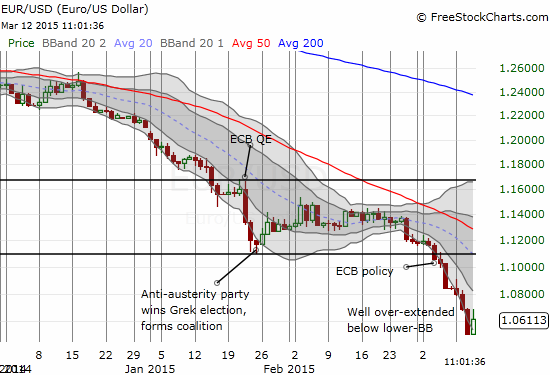
Right at midnight Eastern, the euro made a fresh 12-year low against the U.S. dollar. It was just a nick, but probably enough to knock out a bunch of stops for folks who are still trying to go long the euro (or short the U.S. dollar). The break lasted just five minutes and then a quick reversal. It took another hour or so before the action really took off. I am assuming it took some time for euro shorts to decide that the currency was not going any lower for now.
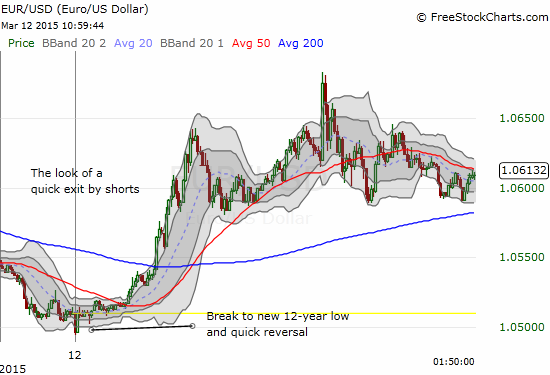
I saw this in real-time partially because I was on the lookout for something dramatic. The euro has been selling nearly non-stop for two weeks, and, as I showed in the last T2108 Update, the U.S. dollar (UUP) is starting to go parabolic. Parabolic moves are usually the beginning of the end of momentum. The EUR/USD pair had traded below its lower-Bollinger Band (BB) for days on end; on Wednesday it had extended even further. The time seemed ripe for some combustion with either a dramatic washout whoosh downward and/or a sharp reversal.
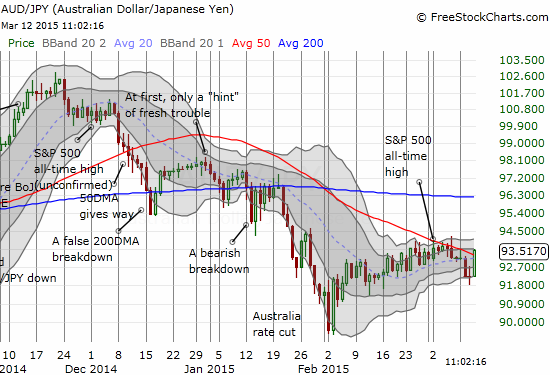
The current narrative in the market is that the U.S. dollar strength is bad for the market – nevermind that the dollar has been rallying for months without so much has harming a hair on the market’s head. So, this sudden dollar weakness could provide an easy excuse for shorts to run and buyers to buy. Moreover, the Australian dollar got new life in what could have been a delayed reaction to an employment report that did not look too bad. My favorite forex indicator, the Australian dollar (FXA) versus the Japanese yen (FXY), AUD/JPY, soared on the day and rallied right back to 50DMA resistance. I am now watching the trading action here like a hawk.
All this fresh bullishness has me wary of the bearish trading bias, but I am sticking to it until I am forced to stand down. As I mentioned earlier, my compromise here is to avoid getting aggressive with bearish bets until fresh bearish signs emerge.
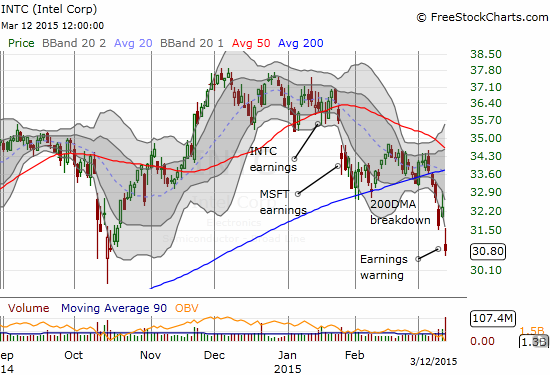
One bearish development is the breakdown of Intel (INTC). I found it truly amazing to see the market rally as well as it did despite this warning:
“Intel Corporation today announced that first-quarter revenue is expected to be below the company’s previous outlook. The company now expects first-quarter revenue to be $12.8 billion, plus or minus $300 million, compared to the previous expectation of $13.7 billion, plus or minus $500 million.
The change in revenue outlook is a result of weaker than expected demand for business desktop PCs and lower than expected inventory levels across the PC supply chain. The company believes the changes to demand and inventory patterns are caused by lower than expected Windows XP* refresh in small and medium business and increasingly challenging macroeconomic and currency conditions, particularly in Europe.
The data center business is meeting expectations.
The company is forecasting the mid-point of the gross margin range to remain at 60 percent, plus or minus a couple of percentage points, as lower PC unit volume is offset by higher platform average selling prices. Expectations for R&D and MG&A spending and depreciation in the first quarter remain unchanged.
All other expectations have been withdrawn and will be updated with the company’s first-quarter earnings report on April 14.”
…that resulted in a dramatic breakdown that confirms a bearish configuration for INTC.
Note that Intel’s description of challenging macroeconomic conditions in Europe did not stop the rally in the euro.
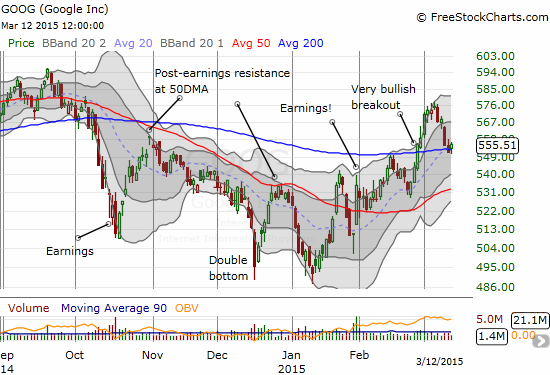
As I have mentioned earlier, I have bullish feelings for Google (GOOG) no matter what happens in the general market until a 50DMA breakdown. Today, the stock seemed to rest perfectly on 200DMA support. I added to my call options today. I like the convergence of the 20 and 200DMAs.
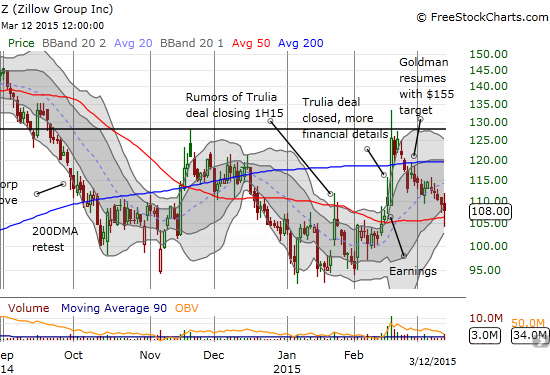
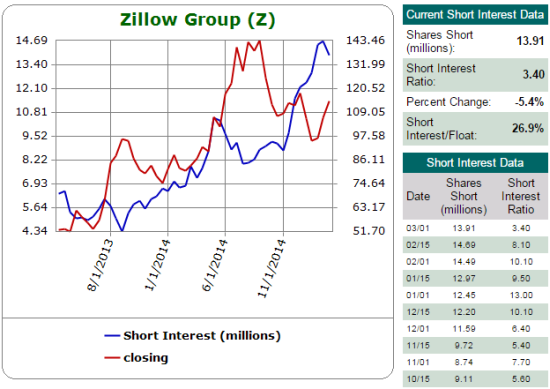
Finally, Zillow (Z) continues its bearish droop…and this despite a Goldman upgrade timed perfectly for the day after I pointed out Zillow’s bearish fade. Zillow gapped up that day but failed to pierce through 200DMA resistance. It has traded mostly downhill since then. Today, it broke through 50DMA support but bounced back. I am now in a hedged position; I added to the bullish side after seeing the recovery. I am looking for a relief bounce at least back to 200DMA resistance. Note how Zillow has completely reversed the bizarre surge that occurred after it closed its deal to acquire Trulia. I also like Zillow as a stock that has its own momentum independent of the market.
Source: Schaeffer’s Investment Research
Daily T2108 vs the S&P 500
")
Black line: T2108 (measured on the right); Green line: S&P 500 (for comparative purposes)
Red line: T2108 Overbought (70%); Blue line: T2108 Oversold (20%)
Weekly T2108

*All charts created using freestockcharts.com unless otherwise stated
The T2108 Resource Page
Expanded daily chart of T2108 versus the S&P 500
Expanded weekly chart of T2108
Be careful out there!
Full disclosure: long SSO put options, long UVXY call options, long Z shares and put options, long GOOG call options