
(T2108 measures the percentage of stocks trading above their respective 40-day moving averages [DMAs]. It helps to identify extremes in market sentiment that are likely to reverse. To learn more about it, see my T2108 Resource Page. You can follow real-time T2108 commentary on twitter using the #T2108 hashtag. T2108-related trades and other trades are sometimes posted on twitter using the #120trade hashtag. T2107 measures the percentage of stocks trading above their respective 200DMAs)
T2108 Status: 63.5%
T2107 Status: 48.8%
VIX Status: 17.3
General (Short-term) Trading Call: Bearish until T2108 goes overbought AND S&P 500 closes at a new all-time high (for more details see below)
Active T2108 periods: Day #76 over 20%, Day #35 above 30%, Day #15 over 40%, Day #4 over 60% (overperiod), Day #146 under 70%
Reference Charts (click for view of last 6 months from Stockcharts.com):
S&P 500 or SPY
SDS (ProShares UltraShort S&P500)
U.S. Dollar Index (volatility index)
EEM (iShares MSCI Emerging Markets)
VIX (volatility index)
VXX (iPath S&P 500 VIX Short-Term Futures ETN)
EWG (iShares MSCI Germany Index Fund)
CAT (Caterpillar).
Commentary
T2108 teased us again with a close encounter with overbought status. T2108 traded as high as 68.96% before closing at 63.5%. Based on previous experience, I think this is close enough to change the short-term trading bias to bearish. When T2108 last had a close call with overbought status it preceded a small pullback into mid-December (that of course set up the subsequent Santa Claus rally…chop..chop). In this case, the close encounter was followed by a strong fade. It will take overbought status and a fresh all-time closing high on the S&P 500 (SPY) to invalidate this bearish trading bias. The trading bias is reinforced by the S&P 500’s fade at the top of 2015’s trading chop and from its level when overbought status last eluded the S&P 500 (think sloppy head and shoulders top).
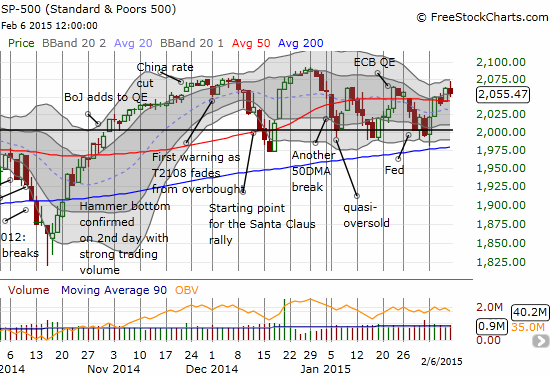
Surprisingly, the volatility index (VIX) only managed a 2.6% gain, and it too faded notably from its high.
With earnings season mostly a fading memory and another U.S. jobs report out of the way, this coming week should be a key technical juncture for the market.
Here are some charts of interest to help pass the time this week and beyond. Please recall that the trading bias refers specifically to the S&P 500 and does not prevent me from making opposite calls on individual stocks. However, those opposite calls definitely have higher hurdles to meet to trigger a trade.
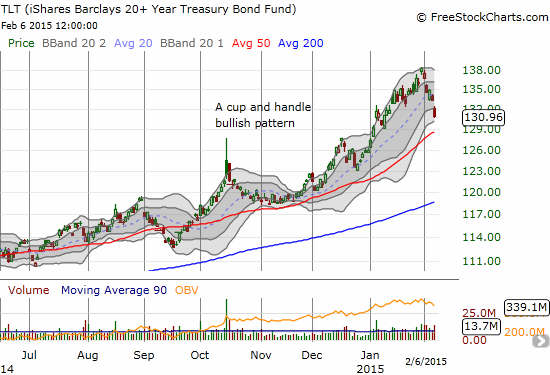
iShares 20+ Year Treasury Bond (TLT)
The bullish cup and handle pattern I pointed out earlier worked like a charm for iShares 20+ Year Treasury Bond (TLT). The rally extended much further than I expected so I did not benefit from recent highs. As much as I am startled by the continuing plunge in bond yields all around the globe, I will stick with the trend here and look to get back into TLT call options on or around the 50DMA support line.
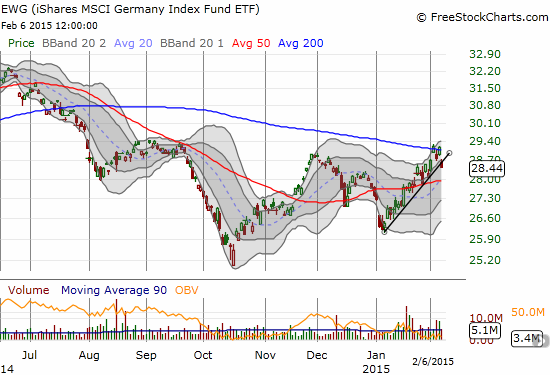
iShares MSCI Germany (EWG)
Last week I pointed out the bullish breakout for iShares MSCI Germany (EWG). The breakout from the 200DMA did not last long and now EWG has cracked the nice uptrend from recent lows. I still like EWG as a play on a weak/weakening euro. I bought call options expiring January, 2016, so I can stay patient. I will definitely add on dips until/unless January, 2015’s low gets violated.
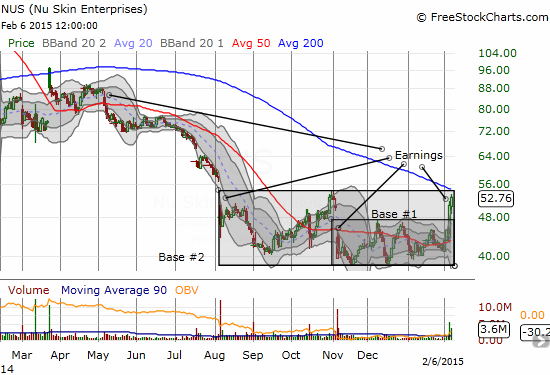
Nu Skin Enterprises Inc. (NUS)
NUS is a fascinating stock for many reasons. The technical setup is now particularly alluring as a potential bottoming process finally launching. I drew boxes to show the most important breakout from “Base #1”, representing the consolidation pattern over the last three months. NUS broke out last week after reporting earnings that the market FINALLY liked. NUS is now headed for a double-test of its 200DMA and the trading range marked by “Base #2.” A second breakout will be extremely bullish for NUS.
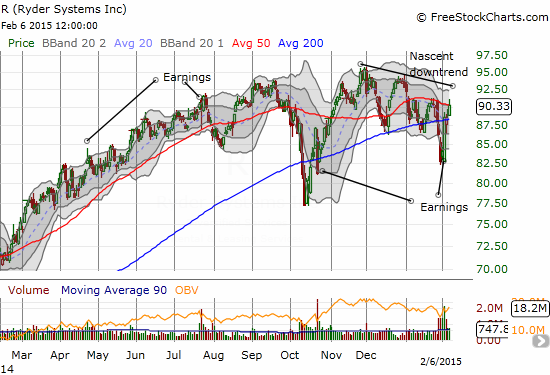
Ryder System, Inc. (R)
Someone on twitter brought Ryder System, Inc. (R) to my attention. The company reported headline earnings that appeared pretty bad, but the stock skyrocketed anyway. The strong response repeats what seems to be an ability for Ryder to bounce back post-earnings. Still, the stock is printing out a classic shorting pattern as a downtrend develops from its all-time high. The 50DMA has also served as resistance for the entire year. With patience, a short (put options for me) could pay off well on Ryder.
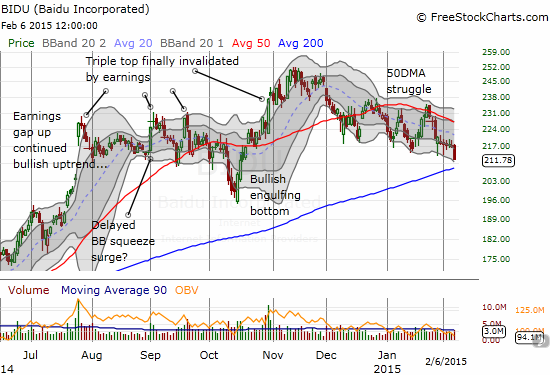
Baidu, Inc. (BIDU)
Baidu, Inc. (BIDU) reports earnings on the evening of February 11th. This report will come at a very critical technical juncture for the stock as it has failed to break recent 50DMA resistance. A very important retest of the 200DMA also approaches. I have been a BIDU bull in the recent past, but I have no trading bias going into the earnings call. I will be watching the market’s response and will trade off key technical levels if the opportunity presents itself. Given my bearish trading call on the market, I will be predisposed to follow bearish indicators rather than bullish ones.
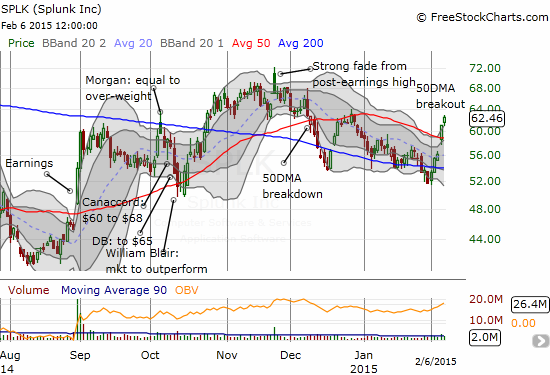
Splunk, Inc. (SPLK)
Splunk, Inc. (SPLK) does not report earnings until February 26th, but I maintain a very strong opinion on the stock – a bearish one. However, the current breakout from 50DMA resistance that confirmed 200DMA support must be respected…even if the move is just in sympathy with a bullish response to earnings from Tableau Software, Inc. (DATA). I used the breakout to initiate a new trade in accordance with a dual view. I have call options in place to try to ride a continued uptrend into earnings. They expire February 20th so that I avoid paying an earnings-related premium. I have put options to play a likely post-earnings disappointment. My hope is that I can profit enough from the call options to at least pay for the put options which would allow me to ride out the post-earnings response no matter what happens. If the breakout fails, SPLK should quickly fall back to at least 200DMA support before earnings. My worst case scenario is a stock that loses all momentum and just chops its way into earnings.
Daily T2108 vs the S&P 500
")
Black line: T2108 (measured on the right); Green line: S&P 500 (for comparative purposes)
Red line: T2108 Overbought (70%); Blue line: T2108 Oversold (20%)
Weekly T2108

*All charts created using freestockcharts.com unless otherwise stated
The T2108 Resource Page
Expanded daily chart of T2108 versus the S&P 500
Expanded weekly chart of T2108
Be careful out there!
Full disclosure: long NUS, long R puts, long SPLK calls and puts