
(T2108 measures the percentage of stocks trading above their respective 40-day moving averages [DMAs]. It helps to identify extremes in market sentiment that are likely to reverse. To learn more about it, see my T2108 Resource Page. You can follow real-time T2108 commentary on twitter using the #T2108 hashtag. T2108-related trades and other trades are sometimes posted on twitter using the #120trade hashtag. T2107 measures the percentage of stocks trading above their respective 200DMAs)
T2108 Status: 67.4%
T2107 Status: 49.3%
VIX Status: 16.9
General (Short-term) Trading Call: Neutral – waiting for resolution of this move toward overbought status
Active T2108 periods: Day #75 over 20%, Day #34 above 30%, Day #14 over 40%, Day #3 over 60% (overperiod), Day #145 under 70%
Reference Charts (click for view of last 6 months from Stockcharts.com):
S&P 500 or SPY
SDS (ProShares UltraShort S&P500)
U.S. Dollar Index (volatility index)
EEM (iShares MSCI Emerging Markets)
VIX (volatility index)
VXX (iPath S&P 500 VIX Short-Term Futures ETN)
EWG (iShares MSCI Germany Index Fund)
CAT (Caterpillar).
Commentary
I could easily talk breathlessly about how T2108 continues to surge toward overbought conditions. However, with a U.S. jobs report coming early Friday morning that could easily change the technical outlook, I will focus in on a few key observations and trading updates. I will do my best to avoid any predictions.
T2108 closed at 67.3%, its highest close since late November’s close encounter with overbought conditions. This is the third out of the last four trading days where T2108 has exhibited large gains. I consider today’s surge to be a confirming follow-through to Tuesday’s breakout. The S&P 500 (SPY) delivered on this follow-through with a 1% gain that pushes the index off its 50-day moving average but right at the top of the churn in place since the beginning of the year.
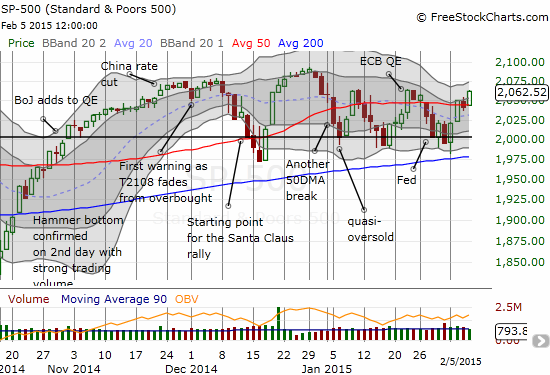
The VIX dropped another 8% but also remains well within its recent chopping range. So the market is now very primed to maintain its ranges with a pullback in the S&P 500 and a resurgence in volatility. I will consider a break of these ranges to be a VERY bullish event even with T2108 crossing into overbought territory (extended overbought rally anyone?).
There has been a LOT of interesting action as a result of currency swings, commodity swings, and earnings. I will highlight just a few here.
Conns Inc. (CONN)
CONN experienced a strong post-earnings response. The latest surge in CONN came in the form of a 24% gain that pushed the stock right into 50DMA resistance.
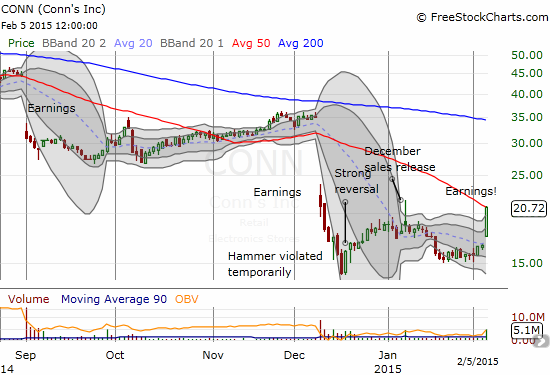
When I last wrote about CONN, I was in semi-defeat. An 11% drop forced me to stop out of my position in CONN shares for risk management purposes. I replaced the shares with call options “just in case.” Many traders can attest to that feeling that a move against them only ends once they finally stop out and give up. Sure enough, CONN immediately stopped going down and even failed to formally retest 52-week lows. Fortunately, my call options made up for everything and then some. For THIS trade, I was primed to sell into the rush. I kept waiting for a sign that a fade was starting similar to the one that vaporized my gains a month ago. The stock instead kept rising just enough into the close to keep me engaged to the last few minutes.
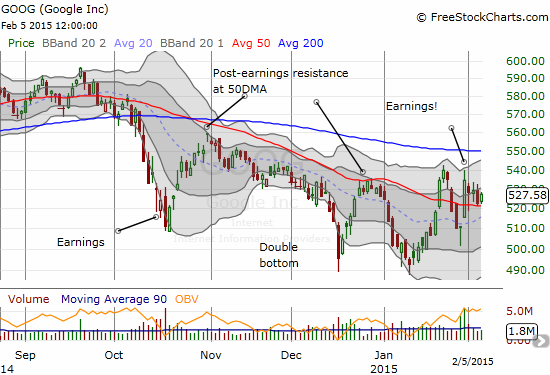
Google (GOOG)
It still seems like “something” is up in GOOG. The stock’s post-earnings momentum has come to an abrupt stop. The stock is now bouncing up and down just above 50DMA support. While I look for the next big move (up or down), I am playing the ranges with a bullish bias since the stock is above its 50DMA.
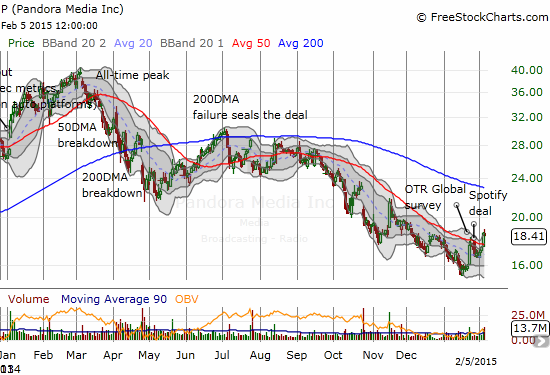
Pandora (P)
I wrote last week about my reasons for playing Pandora ahead of earnings with put options. As luck would have it, last week’s 50DMA failure transformed into this week’s breakout. Undeterred, I doubled down on my position. I made this trade despite what looked like at the time a growing uptrend from the lows. Pandora reported tonight, and the market took the stock down 21% in after hours.
I will reiterate that Pandora is a story many of us who have been around for a while have seen before. Pandora is a good company with a good product – good enough to form a story that can provide the appearance of invulnerability to tough, looming, and growing competitive threats. Like so many others in this position, Pandora continues to claim that the competition is not an issue. This claim is required to maintain a premium valuation. Here is a representative quote from Seeking Alpha transcripts from the recent conference call regarding Spotify:
“I think we definitely see terrestrial radio $17 billion opportunity as being the real opportunity. I think Spotify is first and foremost the on demand service that uses its free service to try to drive people to their on demand. So while we do compete in that sense, they are nowhere near the scale that we do, nowhere near the investment and the infrastructure and sales people that we do and so I would say there are certainly probably discussions about them out there, but we don’t see them as at all our large direct competitor in that space.”
Pandora has now followed-through again on a year-long downtrend. The “good news” for the stock is that this downtrend has yet to reverse all of 2013’s impressive run-up.
Oil/dollar/gold
I am starting to think that oil (USO), the U.S. dollar (UUP), and gold (GLD) are all inextricably linked. This week, oil finally showed some significant signs of life. Things got moving with a huge surge Friday and two more days of follow-up. Wednesday delivered a sharp pullback. Today delivered a sharp comeback.
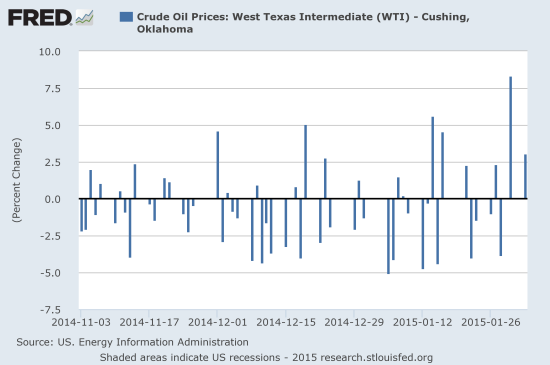
US. Energy Information Administration, Crude Oil Prices: West Texas Intermediate (WTI) – Cushing, Oklahoma [DCOILWTICO], retrieved from FRED, Federal Reserve Bank of St. Louis, February 5, 2015.
The data above are through Monday, February 2. They are sufficient to show the growing volatility in oil now that more and larger positive days have finally arrived. I do not think it is an accident that the U.S. dollar has stalled out just in time for this increasing volatility and relief from selling.
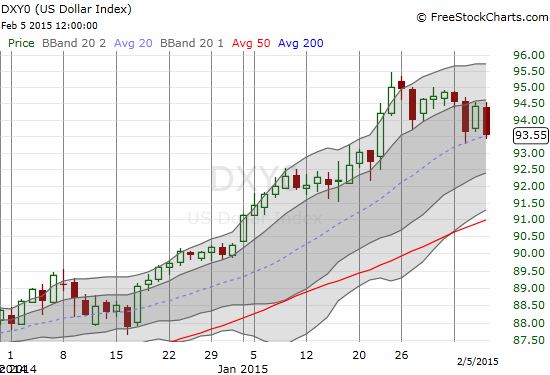
In other words, while so much attention is focused on supply and demand dynamics, the “oil as currency” dynamics are still on display. While the day-to-day correlations are not evident, the directional relationship is evident. What IS surprising is that gold still has a positive bias toward the U.S. dollar. Again, the day-to-day correlations are not precise, but the SPDR Gold Shares (GLD) essentially topped out with the U.S. dollar – right after the European Central Bank (ECB) announced its own program of quantitative easing (QE).
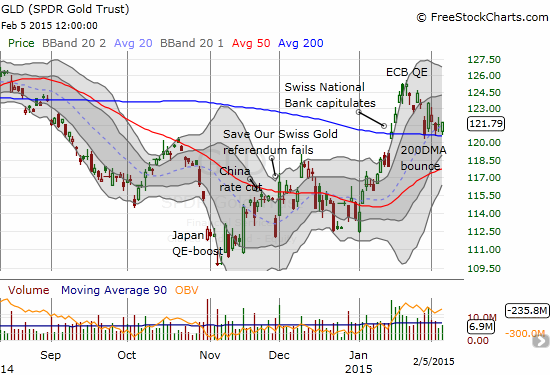
At some point soon I plan to connect the dots more directly. In the meantime, I continue to be skeptical that oil has found a bottom, and I am avoiding any more short-term trades on gold until at least GLD clears the first Bollinger Band (BB) on a bounce away from 200DMA support.
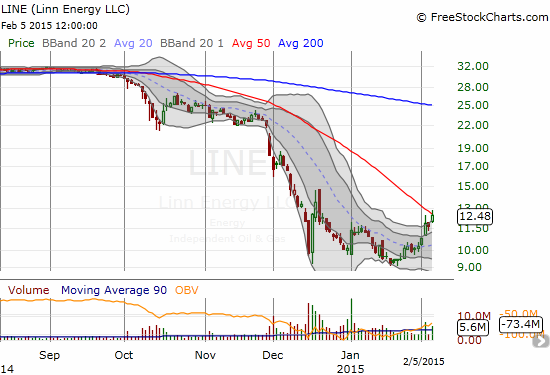
I may have stumbled into a very interesting pairs trade with my dual plays on oil: long shares of Direxion Daily Energy Bear 3X ETF (ERY) versus long call options of Linn Energy, LLC (LINE). While ERY has sagged, LINE has been on an absolute tear in the past week. It now faces a huge test at 50DMA resistance.
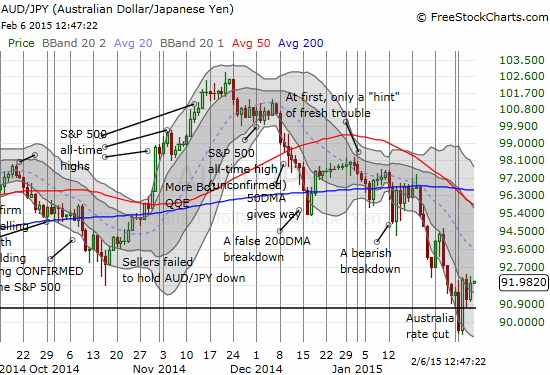
A final note on currencies. The Reserve Bank of Australia (RBA) finally cut rates again and sent the currency reeling. Just like the refusal of gold to strengthen after the ECB’s QE, the Australian dollar bounced right back the very next day. It was part of a general roaring comeback for all commodities besides gold. So, it is like the RBA did nothing at all and tonight’s release of its Statement on Monetary policy did nothing to jawbone some more weakness into the currency.
As regular readers know, last year I used the Australian dollar (FXA) versus the Japanese yen (FXY) [AUD/JPY] as a potential guide, leading indicator or confirming signal, for the S&P 500. The recent weakness in AUD/JPY did NOT produce a breakdown for the S&P 500’s trading bias and direction. This failure may signal the end of this signal’s usefulness. On the other hand, the current rebound and bottoming COULD be adding fuel to the fire of an eventual breakout. Stay tuned.
Daily T2108 vs the S&P 500
")
Black line: T2108 (measured on the right); Green line: S&P 500 (for comparative purposes)
Red line: T2108 Overbought (70%); Blue line: T2108 Oversold (20%)
Weekly T2108

*All charts created using freestockcharts.com unless otherwise stated
The T2108 Resource Page
Expanded daily chart of T2108 versus the S&P 500
Expanded weekly chart of T2108
Be careful out there!
Full disclosure: net short the Australian dollar, long GLD, long P puts, long LINE calls, long ERY, long US dollar