
(T2108 measures the percentage of stocks trading above their respective 40-day moving averages [DMAs]. It helps to identify extremes in market sentiment that are likely to reverse. To learn more about it, see my T2108 Resource Page. You can follow real-time T2108 commentary on twitter using the #T2108 hashtag. T2108-related trades and other trades are sometimes posted on twitter using the #120trade hashtag. T2107 measures the percentage of stocks trading above their respective 200DMAs)
T2108 Status: 51.2%
T2107 Status: 47.1%
VIX Status: 16.4 (down 13%)
General (Short-term) Trading Call: Bullish
Active T2108 periods: Day #65 over 20%, Day #24 above 30%, Day #4 over 40%, day #1 over 50% (overperiod), Day #34 under 60% (underperiod), Day #135 under 70%
Reference Charts (click for view of last 6 months from Stockcharts.com):
S&P 500 or SPY
SDS (ProShares UltraShort S&P500)
U.S. Dollar Index (volatility index)
EEM (iShares MSCI Emerging Markets)
VIX (volatility index)
VXX (iPath S&P 500 VIX Short-Term Futures ETN)
EWG (iShares MSCI Germany Index Fund)
CAT (Caterpillar).
Commentary
When I last wrote a T2108 Update a week ago, the market felt heavy enough to switch my trading bias to bearish. I stuck by the anti-volatility bets but was on the hunt for set-ups to go short on individual stocks. I chose not to chase the S&P 500 (SPY) lower because I tend only to short the index when it is overbought or it experiences a major technical breakdown (well above oversold conditions). As it turned out, the S&P 500 never even retested 200DMA support as sellers completely lacked follow-through. It left me over the last week with very few bearish trades to even try.
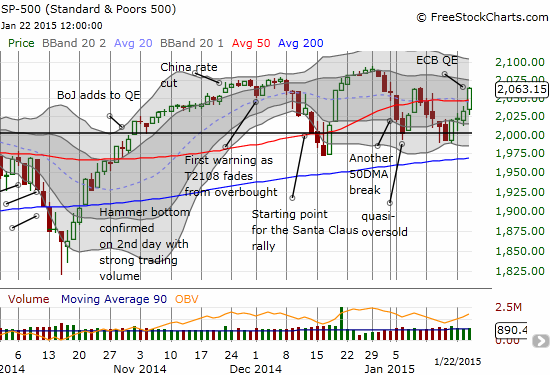
So, the market continues to chop with every move higher and then lower and higher again causing a whoosh of excitement. This time around the excitement came from the soothing salve of the European Central Bank (ECB). Its announcement of a quantitative easing (QE) program was apparently met with great market approval. The apparent impact on volatility was most dramatic and allowed me to close out all my anti-volatility positions with respectable gains: shares in ProShares Short VIX Short-Term Futures (SVXY) and put options on ProShares Ultra VIX Short-Term Futures (UVXY).
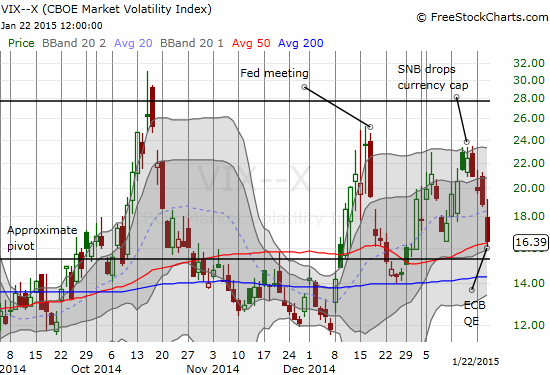
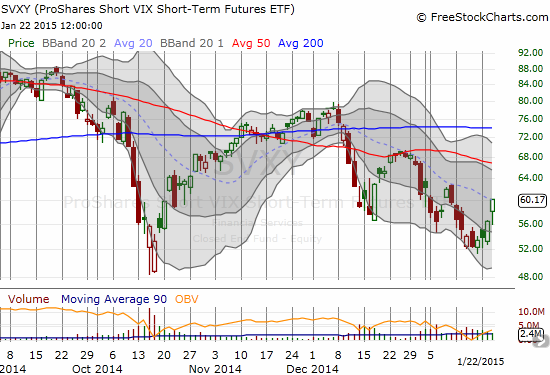
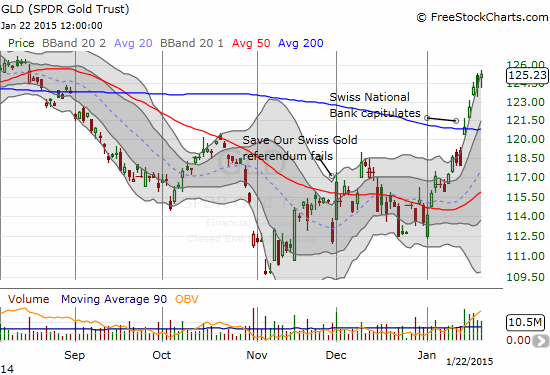
Note how volatility reached a closing cyclical peak after the Swiss National Bank (SNB) threw markets for a loop by dropping its currency cap on the Swiss franc (FXF) against the euro (FXE). A week later, the ECB helped plunge the VIX by 13% in a day, 27% off the last cyclical peak. This latest volatility cycle covered a nice range, but notice how SVXY still appears locked in a downtrend. I am a little more wary of the fade volatility trade and will look for a greater extreme next time I try it.
T2108 closed at 51.2% after an impressive surge of 9 percentage points. T2108 has not managed to move much higher than these levels since the bounce from the December lows. I have no reason to drop my long-standing assumption that the stock market is caught in a choppy range. I have changed the trading bias to bullish only because the S&P 500 broke above its 50DMA. I can only assume that all-time highs will represent a cap. A break to new all-time highs will be bullish with special caveats in place if T2108 tests overbought conditions around the same time.
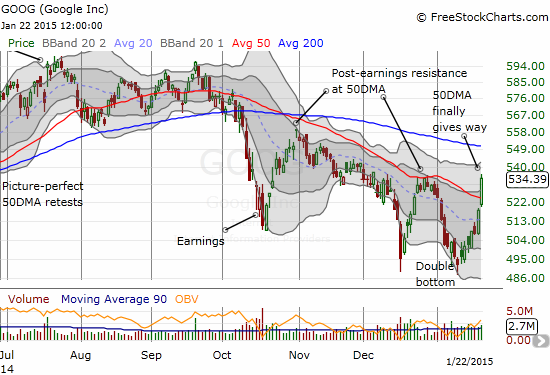
Google (GOOG) is one stock I thought I could fade when the trading bias was bearish. Today, it blew right through 50DMA resistance AND the high from the previous bounce. I set up a trade on put options to trigger only if the stock broke through its low of the day after today’s open; unfortunately the condition triggered and within minutes GOOG was off and running. The stock now looks quite manic. However, since the last low now looks like a hammer bottoming pattern, I must change my trading bias on GOOG to bullish. If I had been prepared to change bias earlier, today’s incredible surge would have made a very profitable trade on call options! Resistance looms overhead from the declining 200DMA.
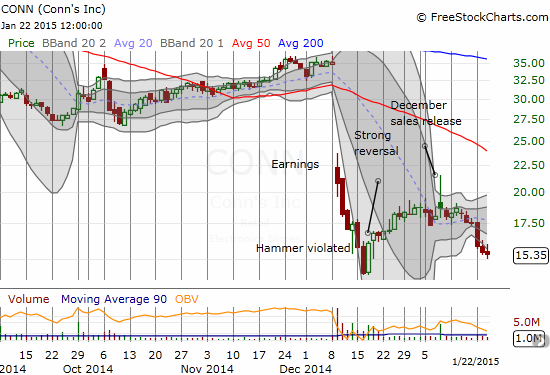
The trade on Conn’s Inc. (CONN) came to an abrupt end as the stock declined 11% to start the week. I was hoping the stock would rebound after January options expiration. The stock position was even at that time and the call option I sold against the stock expired worthless (paying for half of the higher strike call options I purchased). So, I cut the stock loose and bought a few call options just in case the stock revives again.
In some good news, I closed out all my gold-related short-term trades with nice profits yesterday. I sold a bit early as gold took a brief dip. I had a sensitive sell trigger in effect because SPDR Gold Shares (GLD) has been ripping higher well above its upper-Bollinger Band – such moves are rarely sustainable and usually lead to substantial pullbacks at some point. I am looking to buy aggressively into that next dip.
Daily T2108 vs the S&P 500
")
Black line: T2108 (measured on the right); Green line: S&P 500 (for comparative purposes)
Red line: T2108 Overbought (70%); Blue line: T2108 Oversold (20%)
Weekly T2108

*All charts created using freestockcharts.com unless otherwise stated
The T2108 Resource Page
Expanded daily chart of T2108 versus the S&P 500
Expanded weekly chart of T2108
Be careful out there!
Full disclosure: long GLD, long GOOG put options, long CONN call options, net LONG the euro (short term!), short the Swiss franc