
(T2108 measures the percentage of stocks trading above their respective 40-day moving averages [DMAs]. It helps to identify extremes in market sentiment that are likely to reverse. To learn more about it, see my T2108 Resource Page. You can follow real-time T2108 commentary on twitter using the #T2108 hashtag. T2108-related trades and other trades are sometimes posted on twitter using the #120trade hashtag. T2107 measures the percentage of stocks trading above their respective 200DMAs)
T2108 Status: 36.5%
T2107 Status: 41.9%
VIX Status: 22.4 (up 4.2% but failed to close above previous day’s high)
General (Short-term) Trading Call: Bearish
Active T2108 periods: Day #61 over 20%, Day #20 above 30%, Day #2 under 40% (underperiod), Day #11 under 50%, Day #29 under 60%, Day #131 under 70%
Reference Charts (click for view of last 6 months from Stockcharts.com):
S&P 500 or SPY
SDS (ProShares UltraShort S&P500)
U.S. Dollar Index (volatility index)
EEM (iShares MSCI Emerging Markets)
VIX (volatility index)
VXX (iPath S&P 500 VIX Short-Term Futures ETN)
EWG (iShares MSCI Germany Index Fund)
CAT (Caterpillar).
Commentary
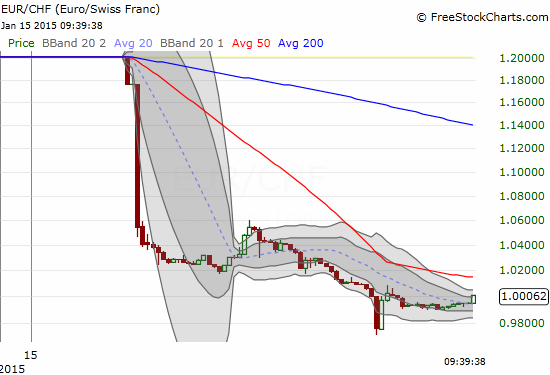
I was just about to write a quick T2108 Update for January 14, 2015 when a bomb dropped in currency markets. The Swiss National Bank capitulated on its 1.20 floor against the euro, sending EUR/CHF quick-fast and in a hurry toward parity. Just like that my assessment of the market’s health took a dramatic southward turn. Needless to say, I failed to write that T2108 Update.
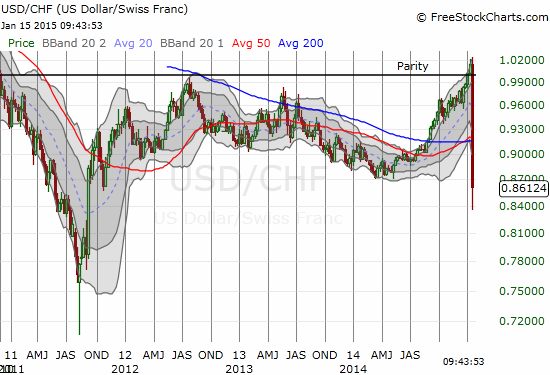
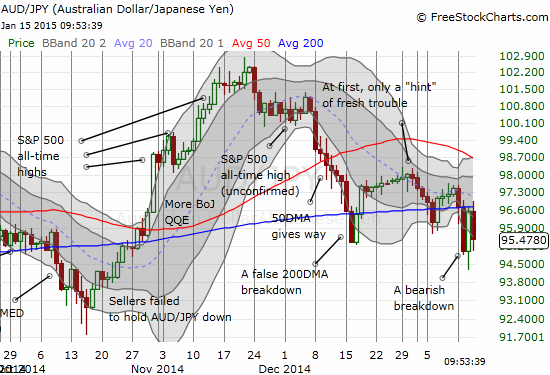
This abrupt change in the forex landscape wreaked havoc for quite some time as traders scrambled to adjust. The Japanese yen (FXY) looked to gain for a while as a new safety currency. The Australian dollar (FXA) fared a LOT better than I would have expected given the sudden expression of risk aversion: the surge in strength in the Swiss franc is a massive display of pent-up demand and market angst. In the end, AUD/JPY completed an ominous fade and failure from what now looks like 200DMA resistance.
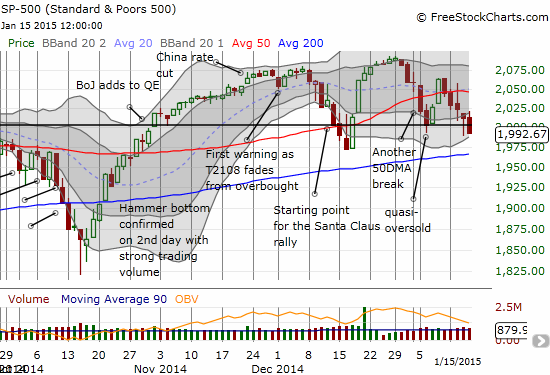
The currency action in total tells me to bias my interpretation of trading on the S&P 500 (SPY) with a bearish tint. Indeed, the index violated a potential hammer from the previous day, broke below 2000, and to add insult to injury, it finally closed below the starting point for December’s Santa Claus rally. A retest of 200DMA support is a mere one or two days of losses away.
T2108 closed at 36.5%. If the S&P 500 makes a 200DMA retest soon, T2108 will be under 30%. Such a break and retest will be “close enough” to consider aggressive buys on the index. However, under these bearish conditions, I will greatly prefer to make a move only when/if T2108 hits oversold conditions (below 20%). Note that December’s low came up short relative to oversold AND the S&P 500’s 200DMA. I was MUCH more bullish then given my expectations for the Santa Claus rally. Note well that the S&P 500 can break 200DMA support and still stay well within the range of chop that I continue to expect for the time being. It iwll take a break of the October lows to significantly change my trading perspective.
The one small bullish hint came from the behavior of the volatility index, the VIX. Even though the S&P 500 made a convincing breakdown AND currency markets were going crazy, the VIX “only” managed a 4.2% gain. The VIX could not even close above the previous day’s high when the markets made a spirited comeback into the close. The highs from December and October are still “miles” away.
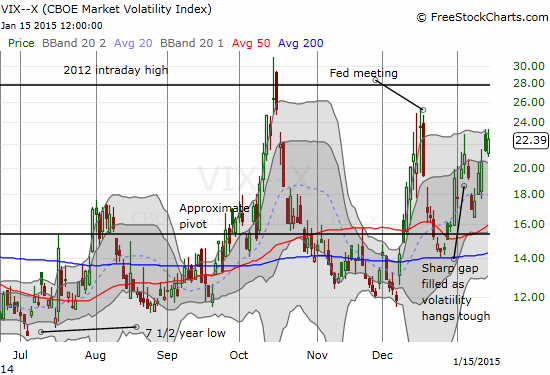
I interpret this reluctant move by the VIX as a sign that the market just needs one positive catalyst (QE for the eurozone anyone?) for volatility to get smashed once again. Accordingly, I nibbled again on shares of ProShares Short VIX Short-Term Futures (SVXY). I am still ready to load up on put options on ProShares Ultra VIX Short-Term Futures (UVXY) if volatility finally does surge well above its upper-Bollinger Band. I will not buy call options on ProShares Ultra S&P500 (SSO) until T2108 hits oversold. In the meantime, most of my trades on individual stocks are focused on shorting opportunities (home builders are a HUGE exception).
Gold has increasingly caught my attention here. Seeing currencies act like the paper-thin playthings of powerful central banks has made me appreciate all over the relatively “realness” of gold (GLD). I think I have good company here. I pointed out in an earlier T2108 Update how gold had remained remarkably resilient in the past few months even as the U.S. dollar continued to power higher. No surprise given the machinations in the currency market that SPDR Gold Shares (GLD) gapped higher today. Even though GLD slammed right into 200DMA resistance, I went ahead and added to my long-term holdings with short-term trades in VelocityShares 3x Long Gold ETN (UGLD) and Direxion Daily Jr Gld Mnrs Bull 3X ETF (JNUG). I am ready to add to my short-term holdings on dips going into the next monetary policy announcement from the European Central Bank.
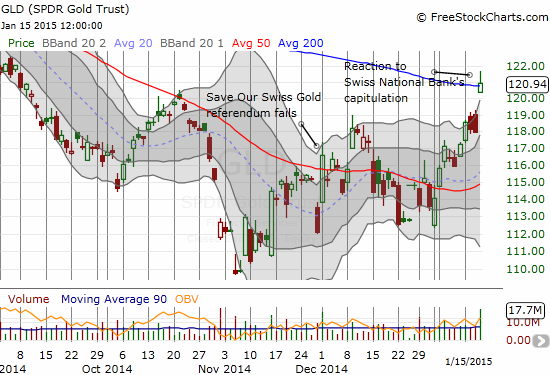
I think the prospects of so much euro paper flailing in the (ill) winds should make gold look better than ever.
Daily T2108 vs the S&P 500
")
Black line: T2108 (measured on the right); Green line: S&P 500 (for comparative purposes)
Red line: T2108 Overbought (70%); Blue line: T2108 Oversold (20%)
Weekly T2108

*All charts created using freestockcharts.com unless otherwise stated
The T2108 Resource Page
Expanded daily chart of T2108 versus the S&P 500
Expanded weekly chart of T2108
Be careful out there!
Full disclosure: net short Australian dollar and the Swiss franc, net long U.S. dollar, long SVXY, long UVXY put options