
(T2108 measures the percentage of stocks trading above their respective 40-day moving averages [DMAs]. It helps to identify extremes in market sentiment that are likely to reverse. To learn more about it, see my T2108 Resource Page. You can follow real-time T2108 commentary on twitter using the #T2108 hashtag. T2108-related trades and other trades are posted on twitter using the #120trade hashtag)
T2108 Status: 39.2%
VIX Status: 12.7%
General (Short-term) Trading Call: Hold (TRADERS BE READY FOR WIDE SWINGS)
Active T2108 periods: Day #310 over 20% (includes day #280 at 20.01%), Day #26 over 30%, Day #3 under 40% (underperiod), Day #6 under 50%, Day #8 under 60%, Day #50 under 70%
Reference Charts (click for view of last 6 months from Stockcharts.com):
S&P 500 or SPY
SDS (ProShares UltraShort S&P500)
U.S. Dollar Index (volatility index)
EEM (iShares MSCI Emerging Markets)
VIX (volatility index)
VXX (iPath S&P 500 VIX Short-Term Futures ETN)
EWG (iShares MSCI Germany Index Fund)
CAT (Caterpillar).
Commentary
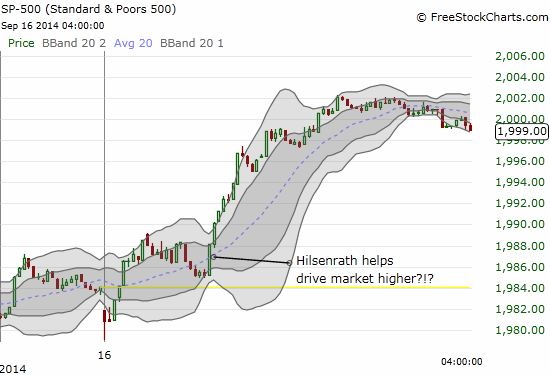
Almost looks like a market hiccup at the open that invited a rush of "bargain shoppers". Sellers have their work cut out for them now. $SPY
— Dr. Duru (@DrDuru) September 16, 2014
This is what I tweeted after I blinked and noticed that buyers had already taken the market upward off the lows and to flatline. Little did I know at the time just how true these words would ring.
I came into the day with the T2108 Trading Model on my mind. It was predicting a down day so the sudden gap down seemed to confirm another day of selling. It was not until the market exploded higher that I realized I needed to switch to a different mental model: a quasi-oversold market just looking for an excuse to buy. That excuse came in the form of WSJ journalist Jon Hilsenrath – someone whose impact my poor little model simply cannot anticipate.
Hilsenrath is the WSJ’s “beat” reporter for the Federal Reserve. He is the one who typically gets to attend the press conferences and ask questions on behalf of the WSJ. Over time, he has apparently developed quite a trusted reputation as a Fed-watcher, but I do not think I have ever seen him (presumably) move markets like he did today – stocks and currencies combined!
Hilsenrath had a simple message, a message that I have essentially made over and over myself: “do not overthink the Fed.” He basically argued that the Fed is in no rush to get hawkish on monetary policy and will look to qualify its “considerable time” framework for raising rates such that the market does not pin the Fed down on a specific calendar date. That was enough to send the market higher in sweet relief. The first chart below shows the action on the S&P 500 (SPY) in 5 minute chunks so the changes in trading are more obvious.
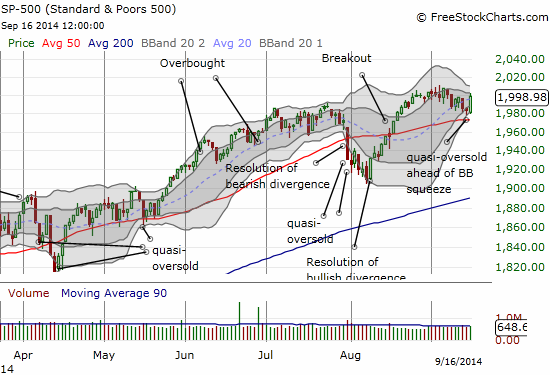
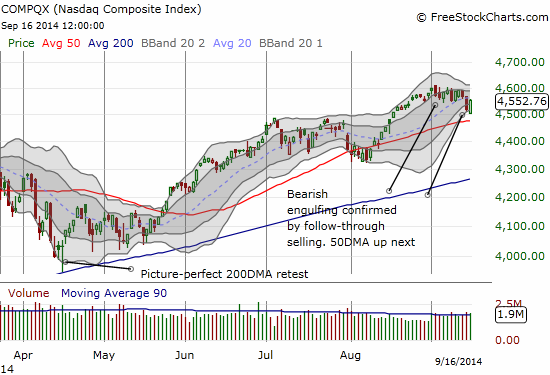
The NASDAQ also benefited, but it is still underneath a bearish topping pattern.
I have adjusted the trading call slightly in the wake of this action. I am maintaining a hold for both bears and bulls, but noting that both sides of the fence need to be prepared for wide swings the rest of this week. I am not going to try to “out think” this one and just hope that I can react quickly and appropriately as the action reveals itself.
I forgot to mention in the last T2108 Update that I decided to go back to buying puts on ProShares Ultra VIX Short-Term Futures (UVXY) because of my perception (I still have not confirmed with the data!) that the Fed tends to dampen market volatility. Of course today’s rally on rate relief smashed volatility and sent UVXY plunging 9.7%. I am still holding a small amount of UVXY shares given September (and October) typically expose market weaknesses. I am definitely dumping the shares by November. In the meantime, trading puts on UVXY remains the big moneymaker.
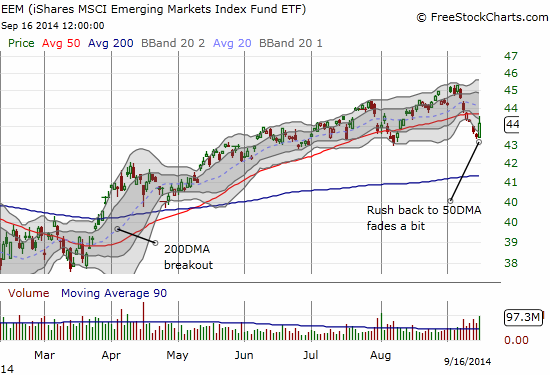
The iShares MSCI Emerging Markets (EEM) was also a beneficiary of the rally. I was quick on THIS trade and rushed to load up on a fresh tranche of puts as EEM approached 50DMA resistance.
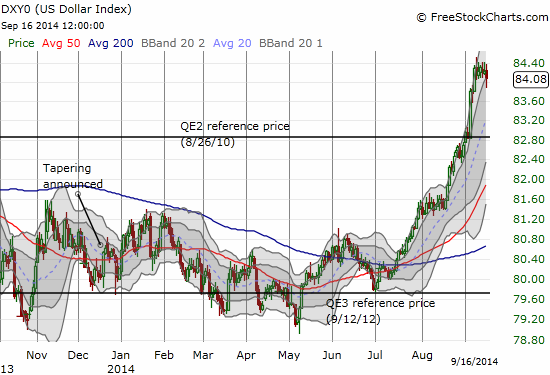
As I mentioned, Hilsenrath was even able to move currencies. While the overall dollar index looks like it just swung from one side of a small room to another…
…individual currency pairs, especially versus the Australian dollar had notable moves. Here is the 15-minute on the Australian dollar versus the U.S. dollar (FXA). I have stretched out the timeframe to show how, in typical fashion, the currency broke a significant technical level at 0.90 only to eventually shoot higher. There was one more tease for good measure.
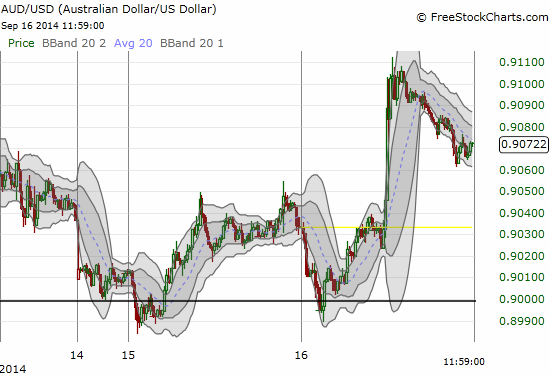
Given I remain firmly bearish on the Australian dollar, I promptly faded this move.
Fader's heaven going on now in #forex markets as the dollar weakens suddenly across the board. fx can only focus on 1 thing at a time. $$
— Dr. Duru (@DrDuru) September 16, 2014
Through all of the excitement, I cannot forget what happened to Apple (APPL).
AAPL gapped down with the market, but its loss at the lows was much more significant, around 1.5%. Like the S&P 500, AAPL shot up immediately off the low. Unlike the general market, it could not manage to close with a gain. AAPL’s ominous behavior just got more ominous.
AAPL has now twice retested the all-time highs set before the September 9th product announcement and failed. This gap down essentially confirms some kind of topping action. As I have said in previous posts, I remain a fan of AAPL, but I think this poor trading action needs to be taken seriously. Only a fresh all-time high can invalidate the bearish reading. The Apple Trading Model (ATM) predicted an up day, but I was much too slow to get in at the great prices on call options at the lows (recall that the best trades on the ATM occur when the stock opens contrary to the prediction). Eventually I decided to match up calls and puts because it seems that AAPL is going to make at least one more big move this week in one direction or another.

Daily T2108 vs the S&P 500
")
Black line: T2108 (measured on the right); Green line: S&P 500 (for comparative purposes)
Red line: T2108 Overbought (70%); Blue line: T2108 Oversold (20%)
Weekly T2108

*All charts created using freestockcharts.com unless otherwise stated
The T2108 Resource Page
Expanded daily chart of T2108 versus the S&P 500
Expanded weekly chart of T2108
Be careful out there!
Full disclosure: net short Australian dollar, long AAPL calls and puts, long EEM puts, long UVXY shares and puts