
(T2108 measures the percentage of stocks trading above their respective 40-day moving averages [DMAs]. It helps to identify extremes in market sentiment that are likely to reverse. To learn more about it, see my T2108 Resource Page. You can follow real-time T2108 commentary on twitter using the #T2108 hashtag. T2108-related trades and other trades are posted on twitter using the #120trade hashtag)
T2108 Status: 50.0%
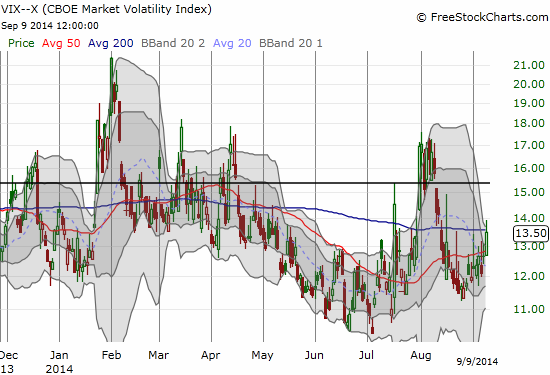
VIX Status: 13.5%
General (Short-term) Trading Call: Hold (Aggressive traders can short with tight stops)
Active T2108 periods: Day #305 over 20% (includes day #280 at 20.01%), Day #19 over 40% (overperiod), Day #1 under 50% (underperiod – minus rounding), Day #4 under 60%, Day #45 under 70%
Reference Charts (click for view of last 6 months from Stockcharts.com):
S&P 500 or SPY
SDS (ProShares UltraShort S&P500)
U.S. Dollar Index (volatility index)
EEM (iShares MSCI Emerging Markets)
VIX (volatility index)
VXX (iPath S&P 500 VIX Short-Term Futures ETN)
EWG (iShares MSCI Germany Index Fund)
CAT (Caterpillar).
Commentary
First there was an ominous print that flagged the end of upward momentum. Next was a close call that demonstrated stubborn resilience again for the buyers. Today, September 9, 2014, the market has swung back into a danger zone. The red flags have brightened enough for me to give the (reluctant) go-ahead for aggressive shorts to stake their claims…with tight stops of course.
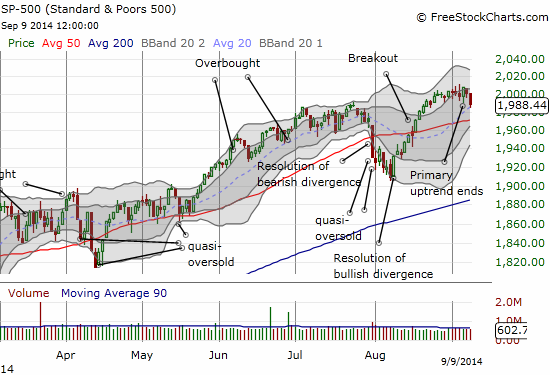
The confirming part of these bearish signals is T2108. It closed a fraction under 50% for the first time in three weeks. Its large drop, 11.4%, confirms the end of its run-up and the divergence that I did not dare call bearish last week. T2108 is now leading the S&P 500 downward.
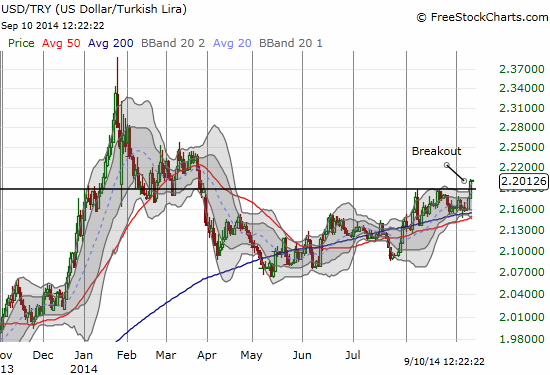
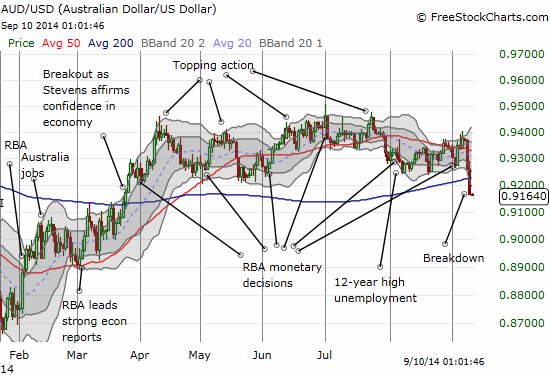
The currency market is providing some additional confirmation for me. Just as I pointed out that the last month of the U.S. dollar’s rally made little to no progress against high-yielding currencies, the U.S. dollar breaks out against the Turkish lira (USD/TRY), and, even more importantly, the Australian dollar breaks down against the U.S. dollar. Moreover, the Australian dollar’s run-up against the Japanese yen (AUD/JPY) has likely come to a definitive end.
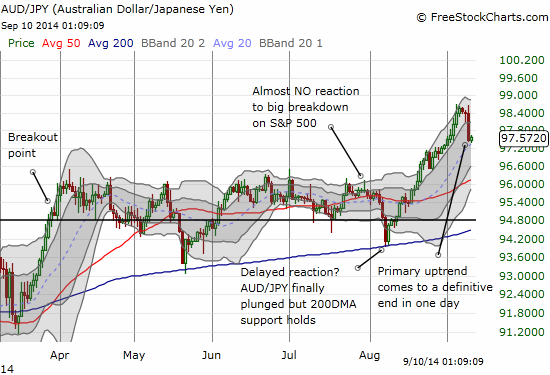
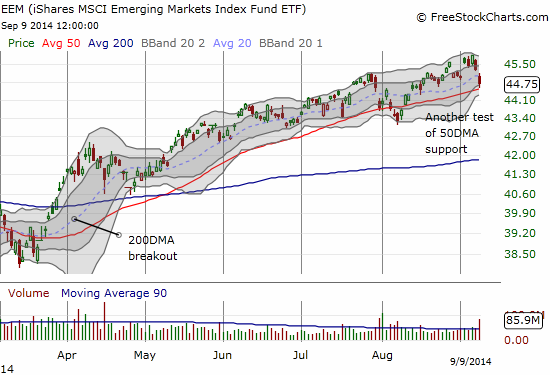
Regular readers know I have looked to the Australian dollar versus the Japanese yen for confirmation of bullish and bearish changes in the market. I see here a confirmation of a bearish change. While I am not yet comfortable taking a short position against the S&P 500 (SPY) here, I did rush to buy a hedged options position in iShares MSCI Emerging Markets (EEM) with a heavy bias on put options. EEM has been surprisingly calm during the U.S. dollar’s run-up. It is still in an uptrend as defined by the 50DMA. However, the currency signals above and the increasing volatility in the currency markets in general tell me to expect greater odds of a significant pullback in EEM. The current pricing for EEM options suggests that the market thinks the relative calm will continue, so I like this trade even more since I can buy a potential pullback on the cheap.
To reiterate, the sentiment and momentum is slowly but surely swinging away from the bulls and buyers. The market is not outright bearish, but all the signs for caution are there. Aggressive traders can certainly feel a lot more comfortable going into short positions with well-defined stops. Look out in particular if the S&P 500 breaks through its 50DMA support again. Let’s also not forget that September is one of the most “dangerous” months of the year.
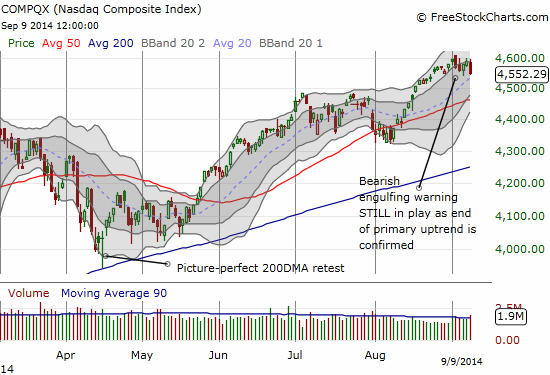
I must end this stock market update with another chart review of Apple (AAPL). The company had its big product announcement today. Despite trading history that tells us NOT to buy into a product announcement, traders did it anyway. The end result was a very wild trading day with large swings in the stock that ultimately settled out into an effective stalemate above 50DMA support. I still think the big sell-off last week ahead of this announcement was ominous enough to take seriously the potential for a more sustained pullback in Apple’s stock. Only a trade to new all-time highs can erase that bearish signal.
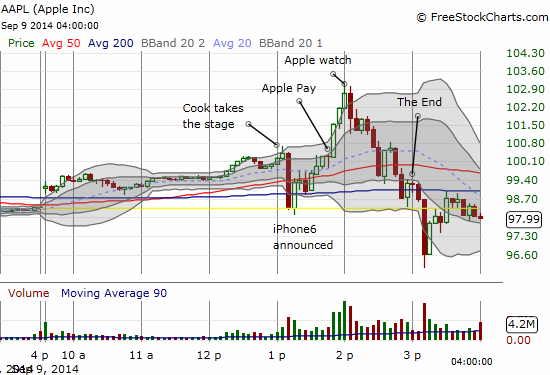
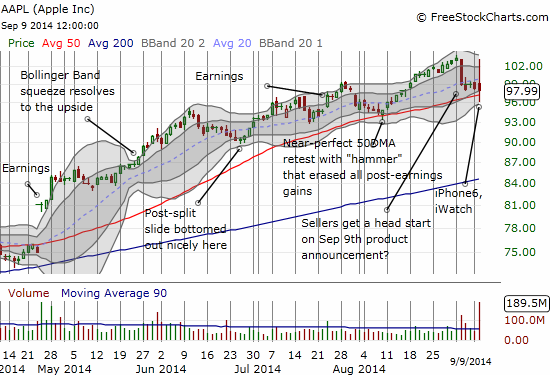
Of course, AAPL’s gyrations just as the NASDAQ (QQQ) is hitting a topping pattern makes the red flags shine all the brighter…
Daily T2108 vs the S&P 500
")
Black line: T2108 (measured on the right); Green line: S&P 500 (for comparative purposes)
Red line: T2108 Overbought (70%); Blue line: T2108 Oversold (20%)
Weekly T2108

*All charts created using freestockcharts.com unless otherwise stated
Related links:
The T2108 Resource Page
Expanded daily chart of T2108 versus the S&P 500
Expanded weekly chart of T2108
Be careful out there!
Full disclosure: long put and call options on EEM, net short Australian dollar, long USD/TRY
Hey Dr Duru – you are sincerely appreciated – so much info out on the web but most is useless – your analytic talent and selfless work is some of the very best – I have become a fan and every day reader/visitor . – so if you ever need or want a website redo, please email me – its on the house. no charge for you – in return for the value of your advice. thanks again,
jim
Thanks for the offer, Jim! I will keep you in mind if I ever get around to the much needed make-over for my Kim Fields fan site. 🙂