
(T2108 measures the percentage of stocks trading above their respective 40-day moving averages [DMAs]. It helps to identify extremes in market sentiment that are likely to reverse. To learn more about it, see my T2108 Resource Page. You can follow real-time T2108 commentary on twitter using the #T2108 hashtag. T2108-related trades and other trades are posted on twitter using the #120trade hashtag)
T2108 Status: 41.2%
VIX Status: 12.4%
General (Short-term) Trading Call: Hold on further buys until/unless S&P 500 confirms a 50DMA breakout. Otherwise, aggressive trades can attempt a fade at 50DMA resistance. See below for more.
Active T2108 periods: Day #287 over 20% (includes day #280 at 20.01%), Day #1 over 40% (overperiod), Day #15 under 50%, Day #26 under 60%, Day #27 under 70%
Reference Charts (click for view of last 6 months from Stockcharts.com):
S&P 500 or SPY
SDS (ProShares UltraShort S&P500)
U.S. Dollar Index (volatility index)
EEM (iShares MSCI Emerging Markets)
VIX (volatility index)
VXX (iPath S&P 500 VIX Short-Term Futures ETN)
EWG (iShares MSCI Germany Index Fund)
CAT (Caterpillar).
Commentary
It pays to keep tabs on the technical signals.
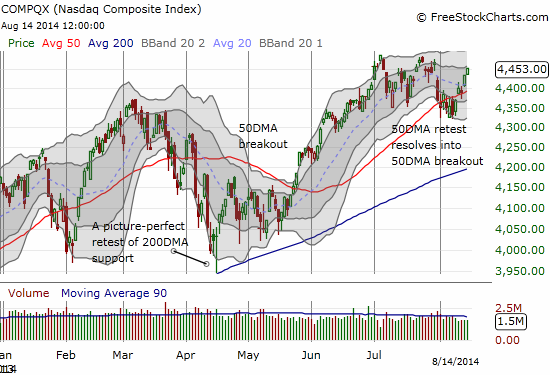
In the last T2108 Update I flagged a 50DMA breakout on the NASDAQ as clearing a path for the S&P 500 (SPY) to retest its 50DMA (as resistance). I thought the move higher would be slow and grinding. Instead, it only took three more days for the test to line up.
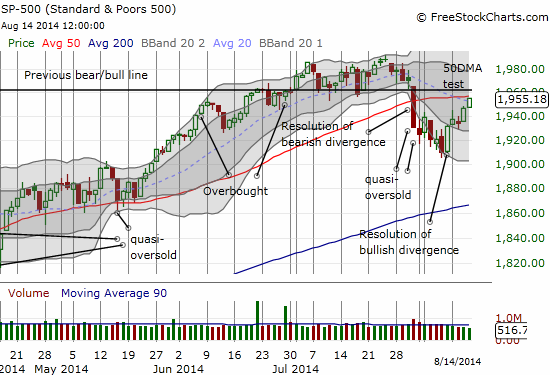
The buyers managed to close the day at the intraday highs. Yet another bullish signal.
T2108 continued its surge upward by closing at 41%. My favorite indicator has doubled from oversold conditions in just 7 trading days. This action has also confirmed the bullish bias.
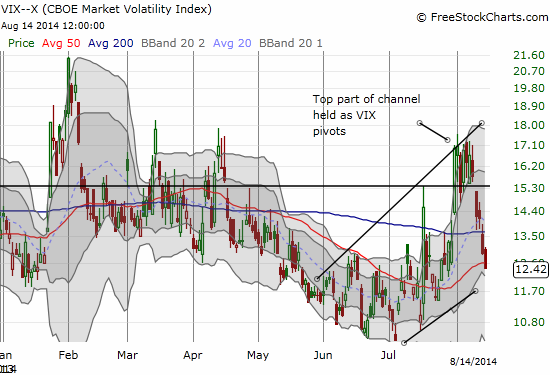
The VIX has plunged and seems headed for a test of the bottom of the presumed (upward) channel. Note that the 50DMA did not act as a brake in today’s trading. I will be monitoring the VIX more closely as the S&P 500 tests the 50DMA.
Given the rapid decline in the VIX, ProShares Ultra VIX Short-Term Futures (UVXY) has plunged. UVXY has not only completely reversed its big breakout at the end of July, but it also looks in danger of cracking new all-time lows.
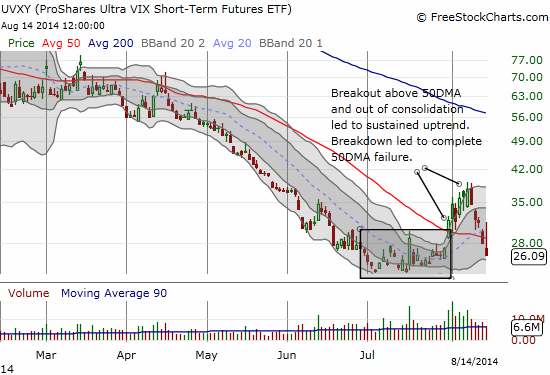
I used today’s decline to close out the rest of my UVXY put options. This latest cycle of UVXY trades was a great learning experience. I managed to profitably sell three tranches of UVXY shares AND a fistful of put options. I am now left with a small number of UVXY shares as a potential play on the S&P 500 failing to break through its 50DMA. Since T2108 is nowhere close to overbought, I am not interested in any aggressive bearish bets here. In fact, if the S&P 500 breaks out ABOVE its 50DMA, I will get even more aggressive on bullish bets (and likely keep the UVXY shares as a partial hedge). In another (re)lesson, my ProShares Ultra S&P500 (SSO) call options will most likely expire worthless on Friday. As I mentioned in a previous T2108 Update, I should have bought SSO shares instead of call options. The shares would have allowed me to wait patiently for the uncertainties swirling around the oversold conditions to resolve to the upside. The S&P 500 is now up 2.5% since its oversold lows.
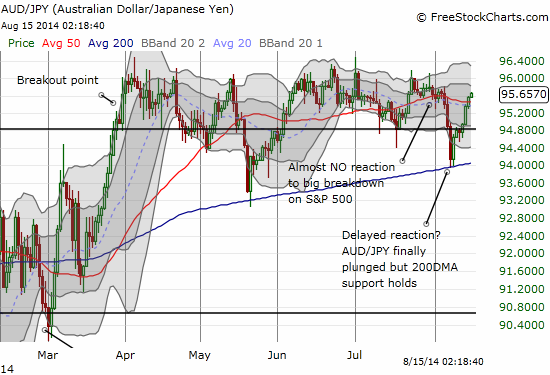
The Australian dollar (FXA) is the final bullish indicator. It is rallying against the Japanese yen (FXY) and serving as a solid confirmation of the bullish jump from oversold conditions. I will be watching AUD/JPY very closely along with the VIX on the S&P 500 50DMA retest. AUD/JPY is in a critical position as it yet again reaches its recent highs. If AUD/JPY manages to leap over the top of the presumed trading channel, I will be compelled to get aggressively bullish if I am not already there at that time.
Overall, the trading rules remain in place. Aggressive traders can short the S&P 500 here on an assumption that the technical damage from July 31st’s massive breakdown below the bear/bull remains intact. I am only interested in SSO put options if/when T2108 goes overbought. My remnant UVXY shares are serving as my main bearish nibble here.
I conclude with a few telling charts….
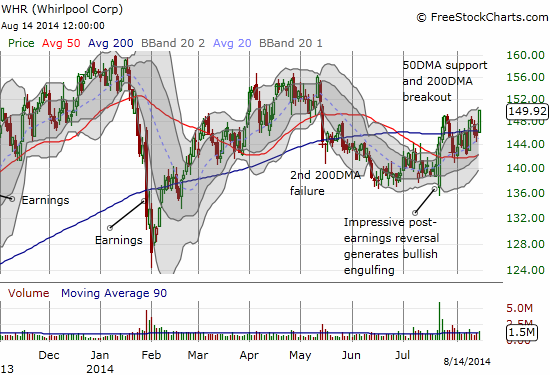
Whirlpool (WHR)
WHR pool has followed-through on its post-earnings bullish engulfing pattern with a breakout above the 200DMA. This is the second time since earnings and includes a successful test of the 50DMA as support along the way. WHR is looking very bullish now and is on my radar if the S&P 500 manages to succeed in its 50DMA rendezvous.
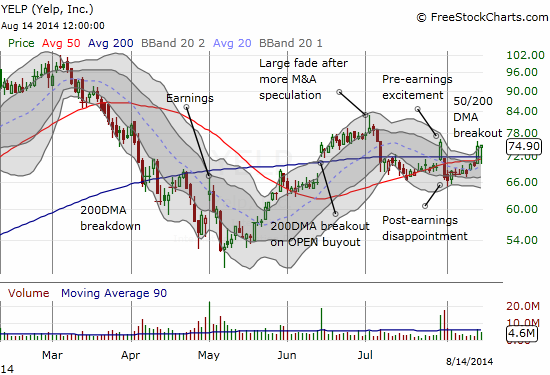
Yelp.com (YELP)
I was ready for a follow-through on the 50DMA breakdown for YELP. Instead, the stubborn stock has reversed course. While this second 200DMA breakout is still at a lower high, YELP looks like it is gathering steam for a fresh run-up.
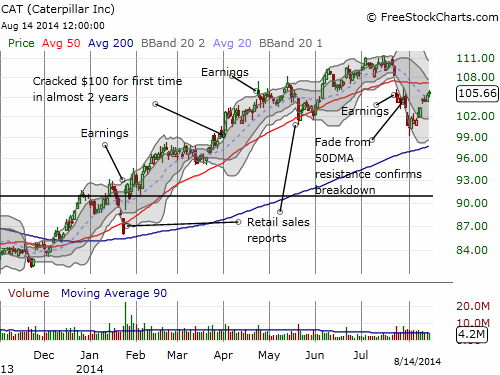
Caterpillar, Inc. (CAT)
A limit order on a fresh CAT put spread triggered today. It was a little early, but CAT is “close enough” to its 50DMA to play another fade. Just like the S&P 500, if CAT manages to breakout above its 50DMA, my outlook gets aggressively bullish on the market.
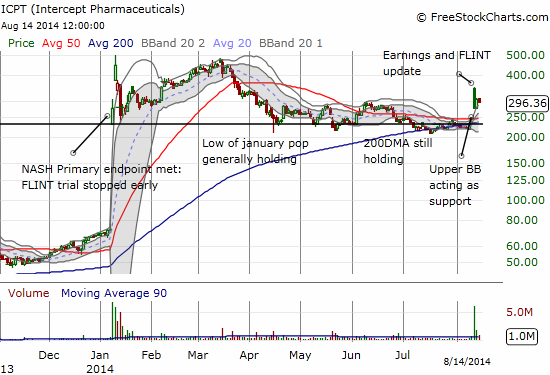
Intercept Pharmaceuticals, Inc. (ICPT)
Two days earlier, I wrote about my growing skepticism on ICPT from a technical standpoint. Of course the stock is currently passing my very first test of buyer exhaustion. Buyers stepped right in the day after the big gap and crap. The upper Bollinger Band (BB) has served as a firm support in a sign that buyers are still in control. I was also right about the likelihood I might not get into any options. I have left open an order on a put spread that remains unfilled… I will be closing it out soon and moving on from a trading perspective.
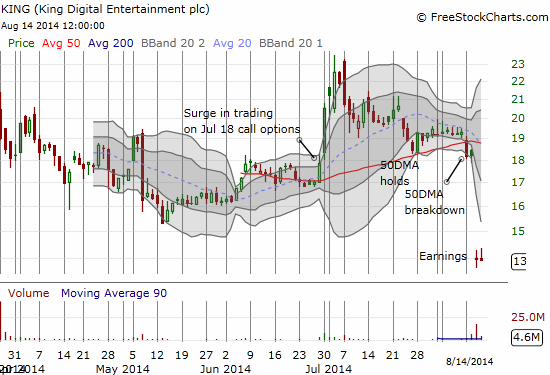
King Digital Entertainment (KING)
Sometimes it is better to be lucky than smart… I wrote about my hesitation to jump back into KING ahead of earnings on a technical breakdown. What a close call. KING thoroughly disappointed on its very first earnings call as a public company. This implosion has demonstrated once again that skepticism is a good tool for filtering your eyes and ears in the stock market.
Daily T2108 vs the S&P 500
")
Black line: T2108 (measured on the right); Green line: S&P 500 (for comparative purposes)
Red line: T2108 Overbought (70%); Blue line: T2108 Oversold (20%)
Weekly T2108

*All charts created using freestockcharts.com unless otherwise stated
Related links:
The T2108 Resource Page
Expanded daily chart of T2108 versus the S&P 500
Expanded weekly chart of T2108
Be careful out there!
Full disclosure: long UVXY shares and puts, long SSO call options, long YELP puts, long CAT put spread and shares, net short the Australian dollar