(T2108 measures the percentage of stocks trading above their respective 40-day moving averages [DMAs]. It helps to identify extremes in market sentiment that are likely to reverse. To learn more about it, see my T2108 Resource Page. You can follow real-time T2108 commentary on twitter using the #T2108 hashtag. T2108-related trades and other trades are posted on twitter using the #120trade hashtag)
T2108 Status: 72.4% (overbought day #2)
VIX Status: 11.6
General (Short-term) Trading Call: Aggressive traders can place new longs. Stop remains below 1940 on the S&P 500
Active T2108 periods: Day #247 over 20%, Day #99 over 40%, Day #26 over 60%, Day #1 over 70% (overperiod)
Reference Charts (click for view of last 6 months from Stockcharts.com):
S&P 500 or SPY
SDS (ProShares UltraShort S&P500)
U.S. Dollar Index (volatility index)
EEM (iShares MSCI Emerging Markets)
VIX (volatility index)
VXX (iPath S&P 500 VIX Short-Term Futures ETN)
EWG (iShares MSCI Germany Index Fund)
CAT (Caterpillar).
Commentary
T2108 inched a bit higher to 72.4% for day #2 of the current overbought period. The S&P 500 (SPY) went absolutely nowhere and volatility jumped slightly. Overall, a very boring day that has not changed the outlook or trading call. So in this T2108 Update, I will focus on some interesting chart reviews for the following stocks: King Digital Entertainment (KING), GoPro (GPRO), Best Buy (BBY), Intel (INTC), and Intuitive Surgical (ISRG). I also include Apple (AAPL) more as a trade review than a chart review to follow-up my trading call in the last T2108 Update. I will do an update on the Tesla (TSLA) trading call later in the week (the stock was looking very good when it hit as high as $244 but then faded right back to the magic pin of $240). I include contextual information on all these charts and trades.
King Digital Entertainment (KING) takes flight
In the middle of the carnage of tumbling momentum and high-multiple stocks, IPOs took a particularly severe beating. At the time, I said the growing skepticism about new issues (which I think is healthy) signaled to me it was time to keep a hawk’s eye out for gems thrown out with the mud. I thought I had found one in King Digital (KING).
KING started trading March 26th, essentially the exact worst time for such an over-hyped IPO to come to market. The fanfare was complete with silly candy characters dancing around the trading floor. CNBC greeted the IPO with derision. It was a severe cynicism that got me very interested in hearing more. The CEO, Riccardo Zacconi, was practically skinned alive as he was forced to defend his business. The good part about the grilling is that he had to be on point. I learned some interesting tidbits about the sustainability and longevity of the business and the breadth of the company’s gaming products. Most interesting to me is that King is a tech IPO featuring real profits as well as healthy revenue growth. The valuation was 3x sales and 11x profit. My head did two or three swivels on THOSE estimates!
Here is the CEO being called to the carpet to answer why his company’s IPO was a “failure.” The clip includes the silly candies standing audience in the background and Jim Cramer pointing the finger at a decline in paying users. For reference, KING’s initial IPO range was $21 to $24, and it priced at $22. The stock opened at $20.50, traded as high as $21.39, before floating downward to close at $19.
Next up, the CEO is asked to convince investors that his company has a sustainable business model and that KING is not just a one-hit wonder.
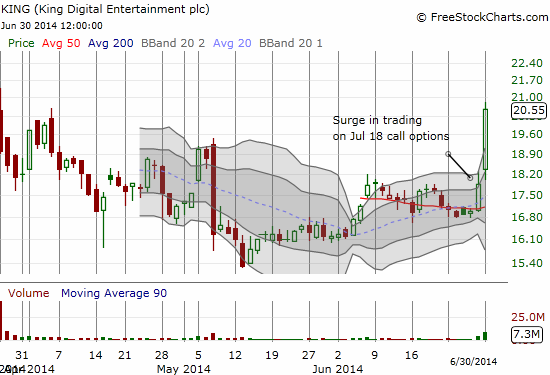
Now fast forward. KING very quietly made a bottom around $15.50 on May 13th just as many momentum and high-multiple stocks finally began to bottom. The stock drifted upward from there, climaxing with a gap up above the 50DMA on the first day the critical hurdle could be drawn. The 50DMA served as nice support even as the stock drifted downward slightly. Suddenly, the stock caught a bid on Friday, June 27th and soared today (June 30th) on a fresh surge in buying volume.

The stock has not made a new high, and it is well-above its upper-Bollinger Band. So, a pullback to as low as $19 relatively quickly will not surprise me. That point could be the “last” good buying point for a while assuming the technicals hold up. Options trading activity suggests this move should/could hold up through at least mid-July.
On Friday, the Najarian twin brothers highlighted KING as a stock experiencing unusual options trading activity. Briefing.com also captured the activity in its feed. The July 18 calls saw a surge of buying. Surprisingly, the stock “only” closed up 5% that day. Perhaps traders were distracted by the Russell rebalancing. Perhaps traders wanted confirmation that the options activity would translate into open interest. Well, confirmation came big time. Open interest went from about 1000 contracts to over 7100. Copycats piled on by trading 5700 contracts on Monday. The end result drove the stock to a 15% gain.
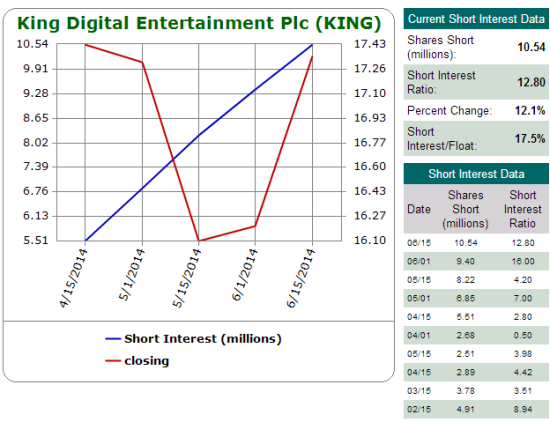
Following options activity is tricky because the instigating trader(s) may know nothing more than anyone else. They may be hedging a trade in the opposite direction. They may be pure speculating. They may even be attempting to goose trading into a stampede in their favor. The surging short interest in KING makes ignition all the easier. Short interest is now 17.5% of float and has almost doubled since the IPO.

I am currently holding a single tranche of shares that I bought on the first day of trading that are now finally even. I bought a second tranche at a much better price (using patience that was more appropriate for the extreme skepticism thrown at KING) and sold that for a nice profit on a nice pop two days later. The options trade has thrown my core hold strategy for a loop because it produces a good possibility that the stock could burn out buyers in the next two weeks. I wanted to hold through earnings as I think the market will get positively surprised by the results: KING will remind the market that it is actually a profitable company with a healthy business. Stay tuned on this one.
GoPro (GPRO) is for the true pros…
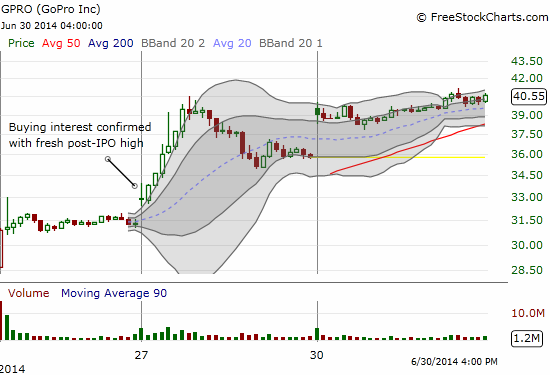
KING was very speculative and relied far too much on what I thought traders and investors SHOULD do – a classic fundamental, predictive approach where bears and bulls can both have valid arguments. GPRO provides a great case study in the better way to trade IPOs, at least for swing trading. It seems counter-intuitive, but it can actually be SAFER to trade stocks like this that are skyrocketing to the moon. The buying interest and power is there. New highs are not to be feared but serve as confirmation of the supply-demand imbalance in favor of demand. It is not about what traders and investors SHOULD be doing. It is all about what they ARE doing. The new high method on IPOs is something my old trading friend schooled me on, yet I have rarely applied it because by nature I am really a contrarian and a “bargain” shopper. (He tracks recent IPOs on his new site swingtradebot.com). {July 1 addendum: my friend reminded me that an additional requirement for playing new highs on IPOs is that they break out of a “base.” In a future post, I hope to provide a good example}.
I finally gulped hard and took a swing on GPRO on the second day after seeing the new high. Technically, this trade is supposed to wait for the close, but I felt the stock was already exhibiting strong buying support. I bought the first pullback and just held on for dear life. I sold into the first surge and grinned like I got away with something. Imagine how far my jaw dropped at the close when I saw GPRO earned as much 25% before settling on a 14% gain on the day! The 15-minute chart is enough said on this 3-day old wonder that confirms speculation and high-multiple stocks are very alive and well again in the current market…

Best Buy (BBY) recovers but now faces potentially stiff resistance
When BBY experienced a post-earnings collapse in mid-January, I made a case for buying the stock. I sold a March put and bought a long-term (January) call spread for “good measure.” While the stock continued to sink for the rest of January, I was eventually made whole on the put position before expiration. The stock eventually made its way back toward post-earnings highs (most of the money I made was on the decline in implied volatility and the loss of time premium). I am still holding the call spread and now warily keeping one eye on the profits and another eye watching overhead resistance at the 200DMA. This is BBY’s next test. I am very likely to hold through the test given the general upward bias now in place in the stock from its recent lows. Having almost seven months to expiration helps my patience.

Intuitive Surgical (ISRG) quietly comes back
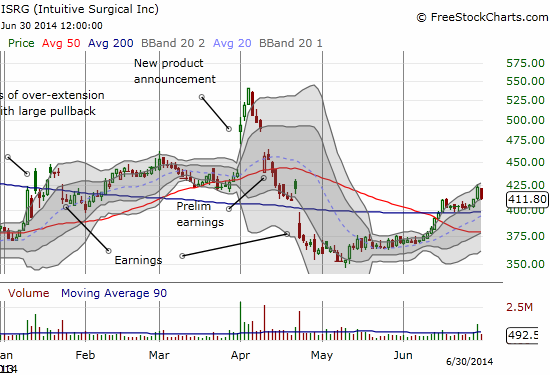
I last talked about ISRG at the end of April. I was sooo tempted to buy at that point because of my general bullishness on the company. I explained my interest in “Some Recent Perspectives From Intuitive Surgical’s Weak Spot: Benign Gynecology.” Unfortunately, I have not yet been able to write any follow-ups from a fundamental basis. I will skip to the bottom-line to say that in the last two weeks the stock has made a bullish move above its 50 and 200DMAs. It also looks ready to follow-through. Admittedly, my attraction to a “bargain” eventually pushed me into speculating on a few shares as ISRG continued to form its bottom. I sold those shares right before ISRG broke out – I assumed that the 50 and 200DMAs would serve as stiff resistance. As readers may recall, I did not pull the trigger at the time I wrote about the stock saying the following: “This is a classic case where I want to stay bullish, but the stock is screaming at me to reconsider…”

Intel (INTC) inside the bulls
I know this post is starting to seem over-celebratory, so I will temper things a bit with the missed opportunity in INTC. INTC has been on an incredible run that tells us that the bull is alive and well. On April 11th, I talked about my success at trading INTC between earnings. My lesson from the first two post-earnings trades was to stay patient in making the entry. On cue, INTC drifted lower post-April earnings. Once it hit the 50DMA, I went on alert. After sellers failed to maintain the momentum from there, I bought a large tranche of July call options. I was pleasantly surprised when in just 9 days these call options increased 2.5x in value as INTC launched off its 50DMA support.
By rule, options should be sold if a trade gets a quick double. However, I missed a caveat in this case with INTC zooming up a very nice uptrend. You can see from the chart below that a simple stop would have kept me in the trade…right through a massive gap up two weeks later. My gains would have gone from 2.5x to at least 10x!!! Needless to say I was disappointed in missing that opportunity. An additional irony here is that if I had been paying closer attention to the fundamentals (as some good friends of mine were bantering back and forth about INTC’s great prospects), I would have likely been more aggressive in holding my calls. Another lesson learned!

Apple (AAPL) likely confirms a post-split bottom
OK, last celebration. I promise. Next time I will include more busted trades for balance.
I had to insert Apple even though only one day separates me from the last discussion of the stock. AAPL gained as much as 1.7% on the day before settling for a 1.0% gain. Along the way, I turned in a 3x gain on my trade following the Apple Trading Model (ATM). I believe the gain ranks in the top 3 or 5 since I started applying the ATM to Apple trades. It was yet another reminder to stick to the model as well as a healthy reminder of the benefits of using weekly options for the ATM trades.
I had to apply some extra patience on the day because my typical approach includes flipping call options quickly into the first Monday surge, especially if I buy at the open as I did this time around. With the technical picture in mind of a likely bottom combined with my bullish T2108 trading call, I decided to hold and set a very aggressive target for my sell order. I consider myself both fortunate and prescient to have this trade execute just as I had hoped.
For reference, the ATM is predicting a 71% chance for upside on Tuesday, July 1st. The odds should be even more in Apple’s favor given the tendency of the general market to record gains on the first trading day of the month. However, once I throw in 2013 data, the odds of upside drop to 27% (in other words a 73% chance of DOWNSIDE). Including 2012 data still tilts the odds in favor of downside. So, I cannot trade on the ATM if Apple gaps up or soars from Tuesday’s open. The odds for a gain AFTER the open are a healthy 70%+ using ALL data going back to 2010, so I will definitely buy call options on a good-sized dip (say at least 0.5%). Such a trade Monday’s close to Tuesday’s close. Stay tuned…
Daily T2108 vs the S&P 500

Black line: T2108 (measured on the right); Green line: S&P 500 (for comparative purposes)
Red line: T2108 Overbought (70%); Blue line: T2108 Oversold (20%)
Weekly T2108

*All charts created using freestockcharts.com unless otherwise stated
Related links:
The T2108 Resource Page
Expanded daily chart of T2108 versus the S&P 500
Expanded weekly chart of T2108
Be careful out there!
Full disclosure: long SSO calls, long TSLA call options and short TSLA shares, long BBY call spread, long KING

The stock market did indeed rally to start the month. I used the surge to sell out of my call options on SSO. I heard on CNBC that this is the best start to the second half since 2010 (or maybe it was 2011?). Also, July has tended to be the strongest month of the year. Once again I say – traders need to keep their eyes open for the summer rally! More stats to come….
I sold my KING shares on July 2nd as the stock made a nice continuation move to an all-time high. This stock will stay on my radar, but it did not make sense to sit on these profits ahead of earnings on such a sharp move higher. I will write more on this trade in the next T2108 Update.