
(T2108 measures the percentage of stocks trading above their respective 40-day moving averages [DMAs]. It helps to identify extremes in market sentiment that are likely to reverse. To learn more about it, see my T2108 Resource Page. You can follow real-time T2108 commentary on twitter using the #T2108 hashtag. T2108-related trades and other trades are posted on twitter using the #120trade hashtag)
T2108 Status: 71.3% (first overbought day)
VIX Status: 11.3
General (Short-term) Trading Call: Aggressive traders can place new longs. Stop remains below 1940 on the S&P 500
Active T2108 periods: Day #246 over 20%, Day #98 over 40%, Day #25 over 60% (overperiod), Day #1 over 70% (overperiod)
Reference Charts (click for view of last 6 months from Stockcharts.com):
S&P 500 or SPY
SDS (ProShares UltraShort S&P500)
U.S. Dollar Index (volatility index)
EEM (iShares MSCI Emerging Markets)
VIX (volatility index)
VXX (iPath S&P 500 VIX Short-Term Futures ETN)
EWG (iShares MSCI Germany Index Fund)
CAT (Caterpillar).
Commentary
T2108 closed above 70% on Friday and is overbought again after a 3-day hiatus. One could argue that T2108 only had a one-day hiatus given the two previous closes: 69.7% and 67.9%. This is an important consideration because traders cannot afford getting churned in and out of positions because stops are too tight for given volatility levels. Indeed, my trading call on the day T2108 fell from overbought advised aggressive traders to hold onto long positions. While the major indices had printed ominous and even classic bearish one-day drops, I preferred to wait for confirmation before getting excited. Sellers simply have had little stamina and follow-through this year; this episode provided yet more evidence.
The end result suggests that tech stocks have not only bottomed out but also are ready to take the leadership mantle away from the (relatively) more sedate S&P 500 (SPY). The NASDAQ (QQQ) closed at a fresh 14-year high while the S&P 500 remains in “coiled spring” mode.
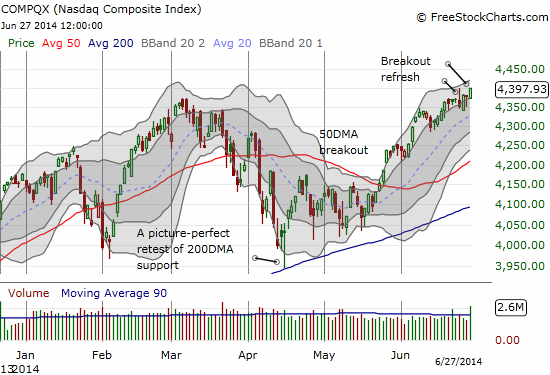
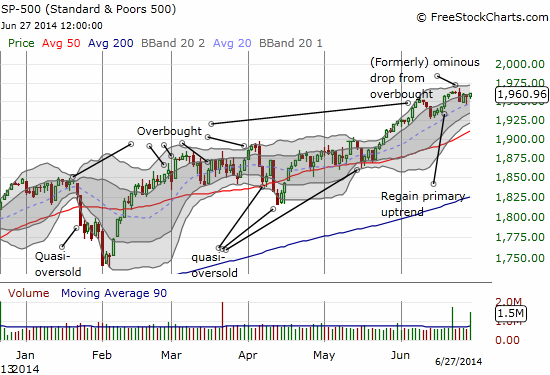
The setup on the NASDAQ puts all the trades I mentioned last week right back into play. Moreover, I took advantage of Thursday’s dip on the S&P 500 to load up on a few very speculative ProShares Ultra S&P 500 (SSO) calls. So far, so good.
There are two particular trades in individual stocks I want to point out here: Apple (AAPL) and Tesla (TSLA).
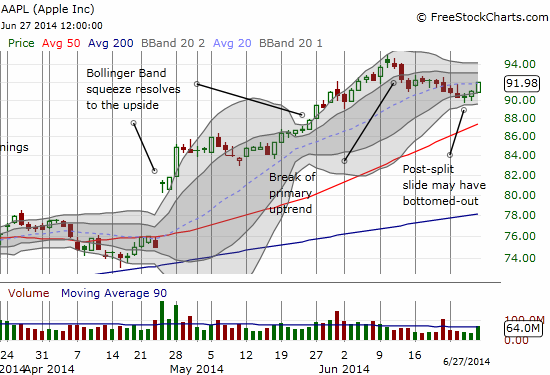
AAPL experienced a nice surge in buying volume on Friday and closed right at the 20DMA. The 20DMA is still biased upward. More importantly, Wednesday and Thursday featured buying off the lows of the day directly above the lower-Bollinger Band, suggesting buyers are taking the baton back from sellers. Friday’s surge puts an exclamation mark on the action. The post-split slip may have finally ended for AAPL.
Note that the move on Friday also violated the Apple Trading Model (ATM) bigtime which generated a strong likelihood of a down day. This move caught me red-handed with puts I had bought for NEXT Friday’s expiration instead of the typical same week Friday. The prediction for Monday is an 88% chance for an upside close. If the market provides a good entry near the open, I am on it. Regardless, a positive close should seal the deal on a fresh bullish run for AAPL. Stay tuned.
The $240 level has trapped Tesla Motors (TSLA) for a week and a half. The stock is also struggling to make a clean break from the April high. Even as this churn occurs, the Bollinger Bands point to a slight upward bias. Pror to this setup, TSLA bounced perfectly off BOTH 200 and 50DMA support. This is as potent a coiled spring as I can imagine and deserves aggressive positioning. If a fresh upward push fails to materialize, I anticipate a strong pullback to move into the “vacuum.” So, I have a small short position paired with call options. I also plan to load up on call options every week until this move resolves. I closed my call option last week for a loss. The previous week, I doubled down and returned a profit as a net double. So, yes, I am very motivated to keep this trade going!
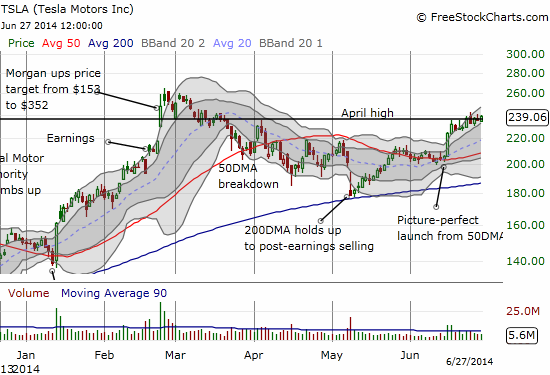
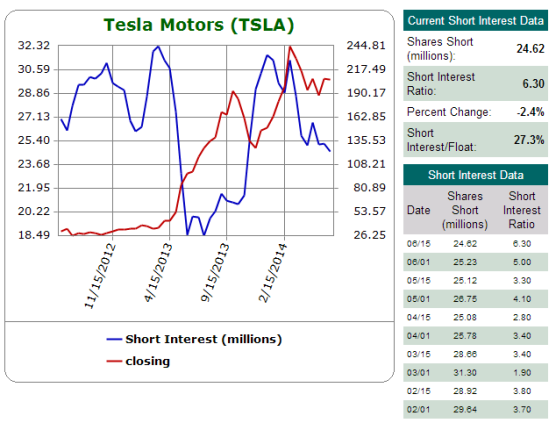
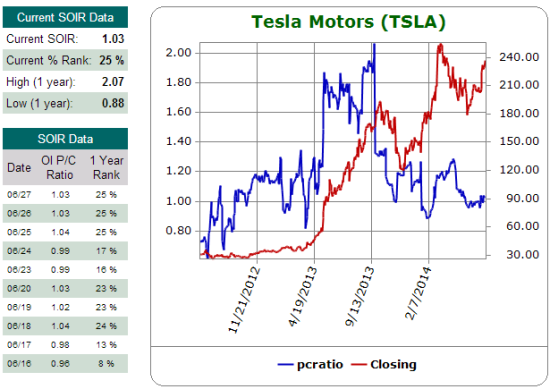
Some more context on TSLA is important. Short interest remains very high at 27% of float. However, short interest has backed off about 20% over the past four months. This is married with a plunge in the open interest put/call ratio. The bullish action in options and the change in sentiment is highlighted by this June 17 mention in Schaeffer’s Investment Research a day after TSLA surgeds off its 50DMA for a 8.8% gain:
“Tesla Motors Inc (NASDAQ:TSLA) is extending yesterday’s advance, up 4.1% at $233.70, as traders celebrate encouraging legal news in New Jersey. Against this backdrop, TSLA call options are trading at four times the average intraday rate, with speculators wagering on more upside for the shares through the end of the week.
So far today, the electric automaker has seen roughly 80,000 calls change hands, compared to around 50,000 puts. Short-term options are once again in demand, as the security’s 30-day at-the-money implied volatility (IV) has popped 3.9% to 44.7%, and the 10 most active options expire at Friday’s close.”
This turned out to be the LOW for the open interest put/call ratio. Skeptics have tentatively wandered back in to drive the ratio a little higher in the past week. Still, this ratio is well off levels seen at April highs and miles away from levels seen around the September/October highs. So if these correlations hold, TSLA has much more upside to go.
Source: Schaeffer’s Investment Research
Assuming the NASDAQ continues higher, BOTH Apple and Tesla should experience strong tailwinds to support my bullish interpretation of the current technicals. Again, stay tuned…!
Daily T2108 vs the S&P 500
")
Black line: T2108 (measured on the right); Green line: S&P 500 (for comparative purposes)
Red line: T2108 Overbought (70%); Blue line: T2108 Oversold (20%)
Weekly T2108

*All charts created using freestockcharts.com unless otherwise stated
Related links:
The T2108 Resource Page
Expanded daily chart of T2108 versus the S&P 500
Expanded weekly chart of T2108
Be careful out there!
Full disclosure: long SSO calls, long AAPL put options (ooops!), long TSLA call options and short TSLA shares