(T2108 measures the percentage of stocks trading above their respective 40-day moving averages [DMAs]. It helps to identify extremes in market sentiment that are likely to reverse. To learn more about it, see my T2108 Resource Page. You can follow real-time T2108 commentary on twitter using the #T2108 hashtag. T2108-related trades and other trades are posted on twitter using the #120trade hashtag)
T2108 Status: 60.7%
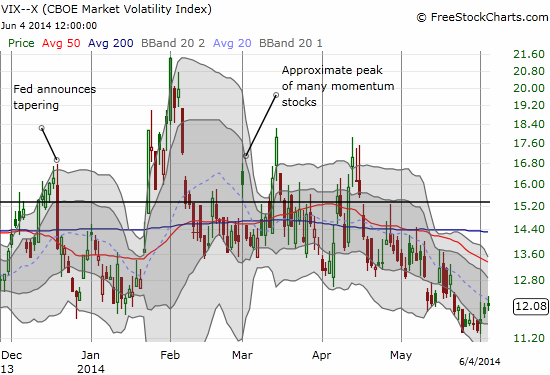
VIX Status: 12.1
General (Short-term) Trading Call: Short on confirmed weakness (see below)
Active T2108 periods: Day #229 over 20%, Day #81 over 40%, Day #8 over 60% (over-period), Day #41 under 70% (under-period)
Reference Charts (click for view of last 6 months from Stockcharts.com):
S&P 500 or SPY
SDS (ProShares UltraShort S&P500)
U.S. Dollar Index (volatility index)
EEM (iShares MSCI Emerging Markets)
VIX (volatility index)
VXX (iPath S&P 500 VIX Short-Term Futures ETN)
EWG (iShares MSCI Germany Index Fund)
CAT (Caterpillar).
Commentary
Six more trading days and the market remains stretched. However, a potentially important divergence emerged today.
I fully expected to see T2108 finally crossing the overbought threshold of 70% after the S&P 500 (SPY) set a fresh closing high and the PowerShares QQQ (QQQ) continued its impressive recovery to a fresh multi-year closing high. Instead, much to my surprise, T2108 took a notable dip today from 64.2% to 60.7%.
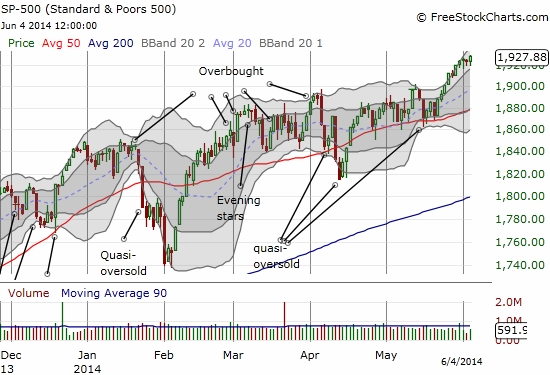
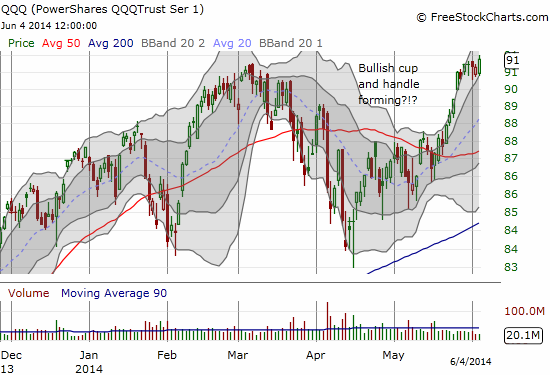
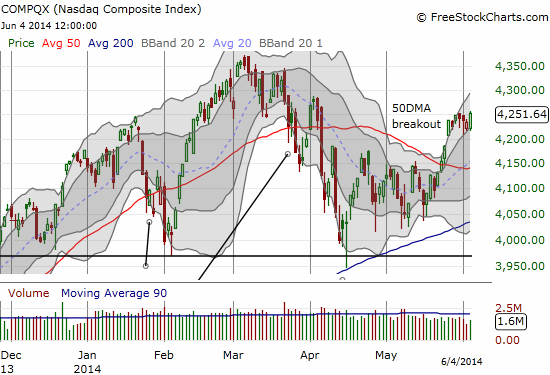
I call this a bearish divergence under the presumption that T2108 is the dominant indicator of underlying market health. I have learned form past occurrences that by itself a divergence is NOT a trading signal. It requires confirmation. So, if the market closes weak tomorrow (June 5, 2014), then I will assume the bearish divergence is confirmed. At that point, I will look to get more aggressively short – mostly high multiple and broken down stocks and more call options on ProShares UltraShort QQQ (QID). The stop out point would be a reversal and return to new closing highs.
This bearish divergence comes on the eve of a highly anticipated monetary event across the Atlantic in the realm of the European Central Bank (ECB). ECB President Mario Draghi essentially promised action with the implied caveat that the June economic data needed to confirm on-going weak inflation numbers. The numbers delivered but will Draghi deliver? $2.8 billion in short positions against the euro say yes. This is an amazing DOUBLING of the bearish bets against the euro over the past week.
I myself am not nearly as short the euro as I expected going into this marquee event. I switched from 100% fading the euro to roughly 75% playing the trend by opening positions on breakdowns. However, the euro stubbornly refused to break below 1.36 against the U.S. dollar with follow-through, leaving me with just short positions using the Japanese yen (FXY) and the British pound (FXB) (I am slightly hedged with a long against the Australian dollar (FXA)). Something tells me I can trust those currencies more against the euro here anyway.
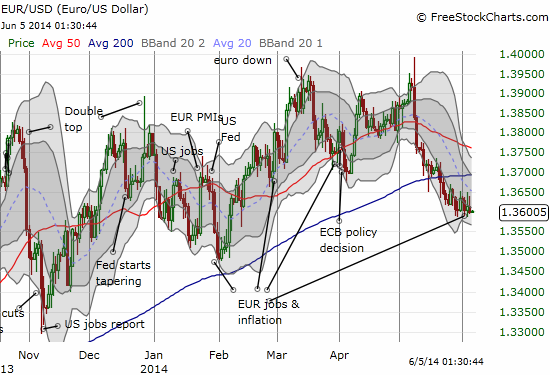
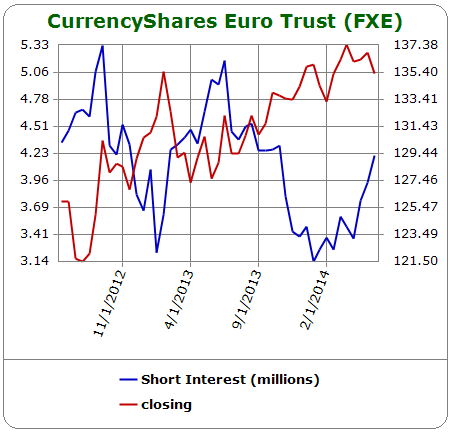
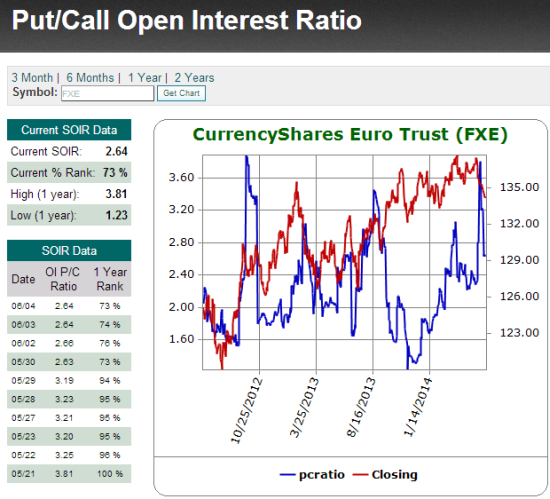
I find it telling that the doubling in value of short positions over the past week did absolutely nothing to weaken the euro. Mario Draghi really has his work cut out for him. Bearish activity against CurrencyShares Euro Trust (FXE) also suggests that the case against the euro is not ironclad here. Shares short have risen by about 1/3 since January and accelerated in recent weeks, but shorts have been even higher in the past two years. The open interest put/call ratio has steadily risen since late last year as the euro has steadily risen over that time. The ratio is at a high level but it actually SPIKED just ahead of the current decline. In other words, traders are not wholly convinced that betting on Draghi to weaken the euro is the best trade of 2014 – as it should be.
Source: Schaeffer’s Investment Research
Source: Schaeffer’s Investment Research
Iplan to stay put in my current positions no matter what the ECB says. I feel comfortable staying longer-term bearish against the euro: the euro will have to weaken at some point to pave the way for a real eurozone recovery. I will use EUR/USD as a “flex” position – that is, I will trade in whatever direction seems to make sense based on a combination of the news and the market’s reaction to it. Obviously, the trade will be a LOT easier if the euro just cleanly breaks the 1.36 level, but I am not holding my breath. If the call is for short-term bullish EUR/USD, then I will start in small amounts and build faster if the move actually maintains its momentum.
Typically, it makes sense to wait until the conference call to make such a judgement call. It should be interesting…especially since the likely reaction in stocks to the ECB decision is hard to call. If the ECB rolls out some massive quantitative easing (QE) program, I have to imagine that stocks all around the globe will suddenly get an extra dose of gasoline for the fire…and the bearish divergence would similarly go up in smoke.
Now wouldn’t it be ironic if absolutely nothing big happens and the day closes little changed from the day before? The historically low levels of volatility in financial markets suggest that “nothing” is the high probability bet to make (like selling options/futures on the euro at high premiums). Stay tuned…
Daily T2108 vs the S&P 500

Black line: T2108 (measured on the right); Green line: S&P 500 (for comparative purposes)
Red line: T2108 Overbought (70%); Blue line: T2108 Oversold (20%)
Weekly T2108

*All charts created using freestockcharts.com unless otherwise stated
Related links:
The T2108 Resource Page
Expanded daily chart of T2108 versus the S&P 500
Expanded weekly chart of T2108
Be careful out there!
Full disclosure: long QID calls, net short euro, net long yen, net short Australian dollar, neutral pound

