
(T2108 measures the percentage of stocks trading above their respective 40-day moving averages [DMAs]. It helps to identify extremes in market sentiment that are likely to reverse. To learn more about it, see my T2108 Resource Page. You can follow real-time T2108 commentary on twitter using the #T2108 hashtag. T2108-related trades and other trades are posted on twitter using the #120trade hashtag)
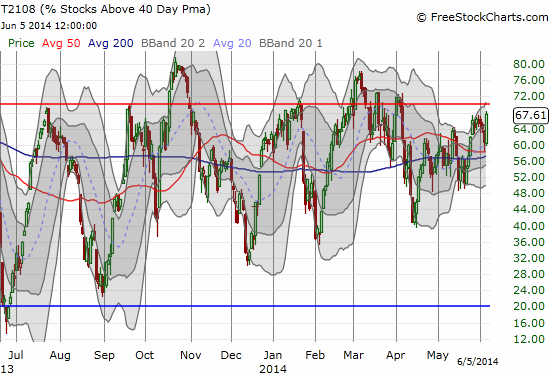
T2108 Status: 67.6%
VIX Status: 11.7
General (Short-term) Trading Call: Short ONLY on confirmed weakness (see below)
Active T2108 periods: Day #230 over 20%, Day #82 over 40%, Day #9 over 60% (over-period), Day #42 under 70% (under-period)
Reference Charts (click for view of last 6 months from Stockcharts.com):
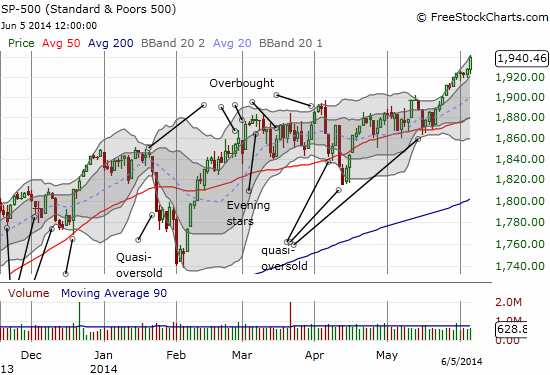
S&P 500 or SPY
SDS (ProShares UltraShort S&P500)
U.S. Dollar Index (volatility index)
EEM (iShares MSCI Emerging Markets)
VIX (volatility index)
VXX (iPath S&P 500 VIX Short-Term Futures ETN)
EWG (iShares MSCI Germany Index Fund)
CAT (Caterpillar).
Commentary
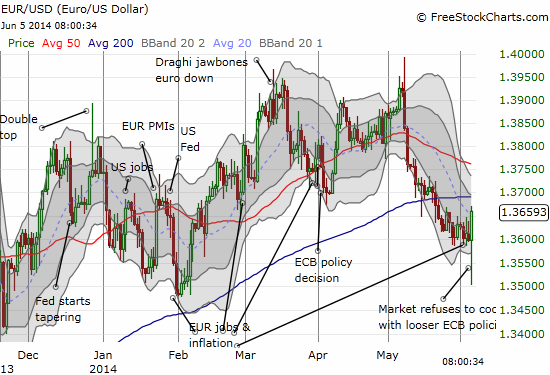
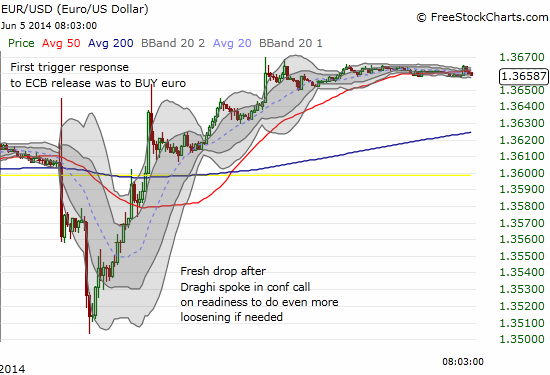
Wednesday’s bearish divergence barely lasted longer than Mario Draghi and the ECB’s attempt to weaken the euro (FXE) through looser monetary policies. The S&P 500 jumped yet again, but this time it was accompanied by a healthy surge in T2108. T2108 closed at its second highest point since last falling from overbought status in early April.
19
This chart is definitely and firmly bullish. A new uptrend is well-established now with baby-steps that are well short of “panic buying.” I probably share a sense of disbelief with a lot of people (or at least of the few who are still paying attention to the market as the summer gets underway!). Suspending disbelief for a while, this setup suggests an imminent extended overbought rally. I had earlier thought hitting overbought would be a bearish event, instead, the melt-up has moved so slowly and so smoothly that overbought does not quite equate to over-stretched here. The biggest caution remains the extreme levels of complacency. If I decide to chase the trend, I will hang disbelief high in a dark closet, behind the old hats and novelty t-shirts…
The good news for the bears is that this setup makes it ever more clear what weakness looks like for triggering fresh shorts. Currently, a close below 1920 on the S&P 500 is shortable. Even better if it occurs on a tumble out of overbought conditions. As the rally extends on the S&P 500, the trigger point increases.
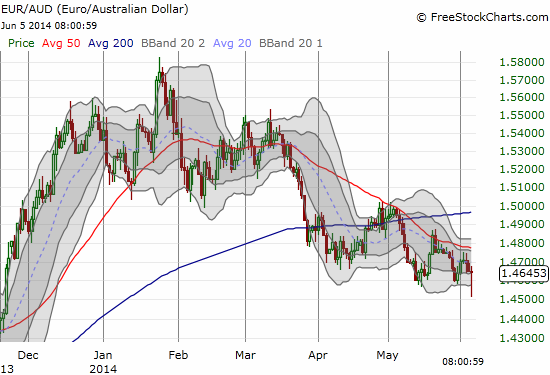
I will have to write a whole separate article on the euro. One important implication of looser monetary policy from the European Central Bank (ECB) that escaped me when I wrote about the play on the euro is the potential for a ramp in carry trades….aka, buy the Australian dollar (FXA). So, while I think I played the gyrations and fake-outs in the euro well, I was not prepared to similarly take advantage of a fresh surge in the Australian dollar. I remain net short the Australian dollar and am rebuilding a short position against the euro. I post related charts below.
Up next, the U.S. non-farm payrolls numbers!
Daily T2108 vs the S&P 500
")
Black line: T2108 (measured on the right); Green line: S&P 500 (for comparative purposes)
Red line: T2108 Overbought (70%); Blue line: T2108 Oversold (20%)
Weekly T2108

*All charts created using freestockcharts.com unless otherwise stated
Related links:
The T2108 Resource Page
Expanded daily chart of T2108 versus the S&P 500
Expanded weekly chart of T2108
Be careful out there!
Full disclosure: net short euro, net short Australian dollar