
(T2108 measures the percentage of stocks trading above their respective 40-day moving averages [DMAs]. It helps to identify extremes in market sentiment that are likely to reverse. To learn more about it, see my T2108 Resource Page. You can follow real-time T2108 commentary on twitter using the #T2108 hashtag. T2108-related trades and other trades are posted on twitter using the #120trade hashtag)
T2108 Status: 66.2%
VIX Status: 11.5
General (Short-term) Trading Call: Short (fade rallies after some confirmation of weakness)
Active T2108 periods: Day #223 over 20%, Day #75 over 40%, Day #2 over 60% (over-period), Day #35 under 70% (under-period)
Reference Charts (click for view of last 6 months from Stockcharts.com):
S&P 500 or SPY
SDS (ProShares UltraShort S&P500)
U.S. Dollar Index (volatility index)
EEM (iShares MSCI Emerging Markets)
VIX (volatility index)
VXX (iPath S&P 500 VIX Short-Term Futures ETN)
EWG (iShares MSCI Germany Index Fund)
CAT (Caterpillar).
Commentary
Perhaps Rocket Fuel (FUEL) really did mark the bottom for high multiple stocks. Perhaps Netflix (NFLX) was indeed trying to confirm that the tide had turned.
NFLX finally had a down day today, but the rest of the stock market, especially in technology, has clearly heard the message. All across the stocks I watch, high-multiple, momentum, etc… stocks clocked in large one-day gains as part of what is an on-going relief rally. The technicals are stretched in nearly every direction as T2108 closes in on overbought levels. At 66.2%, T2108 is at levels last seen on April 4, 2014 when my favorite indicator tumbled from overbought conditions and provided the last good selling signal for the S&P 500 (SPY). The S&P 500 (SPY) rallied just 0.6% but the move stretched it above its upper-Bollinger Band (BB).
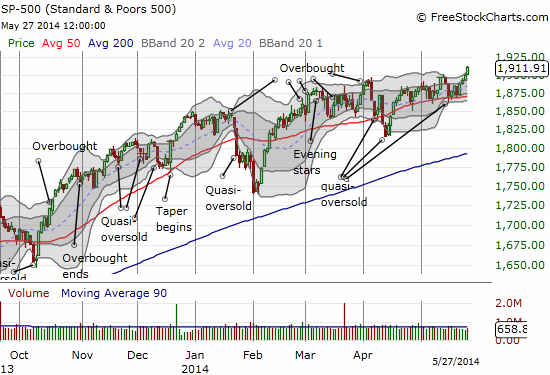
Adding to the stretch is a volatility index, the VIX, that has accelerated to the lows of a trading range in place since late 2012/early 2013. The VIX managed a marginal gain on the day, but it is still stretching toward lows last seen in 2007 just ahead of the financial crisis. I covered the developments on volatilities in a recent Seeking Alpha post titled “Where Is The Risk? The Ironies And Tensions Between Low Volatility And Accommodative Monetary Policies.” I refer the interested reader to that article. The bottom line is that the market is hurtling toward levels of complacency that even makes central bankers nervous.
Given the current stretches, I will NOT be inclined to flip bullish if T2108 goes overbought (70% and above) – the classic extended overbought rally. Overbought combined with ultra-low volatility combined with tech stocks printing 4 to 7% a day combined with major indices stretching above their upper-Bollinger Bands smells like a lethal recipe. I am keeping the trading bias at fade rallies for this reason. I have removed the focus on technology stocks since the monster gains being seen in this sector again make it extremely difficult to place fades; playing breakdowns make more sense now. For example, only shorting after a stock or index breaks the low of the last strong buying day…in many cases, that will be today’s low.
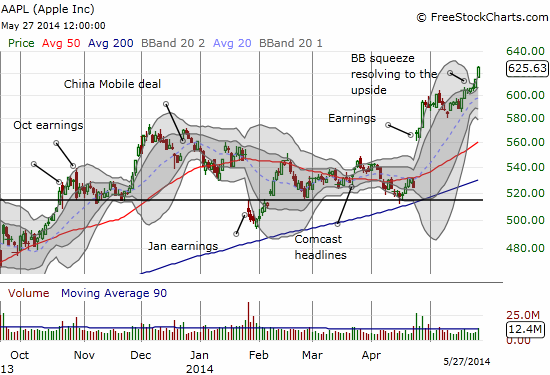
Despite the deafening alarm bells I am hearing, I have to stretch out kudos to Apple (AAPL). I really should have pointed out the Bollinger Band (BB) squeeze in the making last week. The breakout to the upside is VERY impressive.
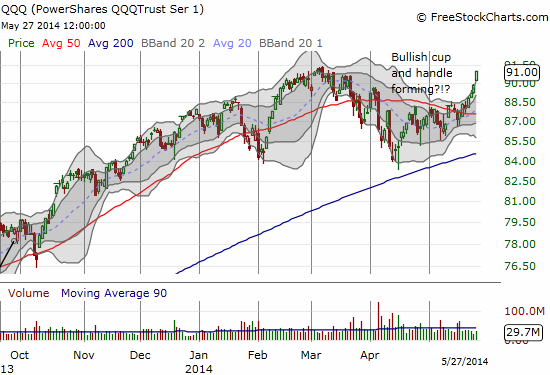
No doubt this breakout helped push the NASDAQ to its breakout above its 50DMA and above its own upper-Bollinger Band. These moves have created a particularly dramatic transformation in PowerShares QQQ (QQQ). Suddenly, QQQ has gone from an ETF trapped under stiff resistance to an index on the verge of printing a very impressive and bullish cup and handle breakout pattern.
Of course, this bullish run has been all about price and almost nothing to do with volume. Even AAPL is barely printing average volume in the current run-up. While low volume has mattered little for many years now, high volume would have at least made me more interested in considering the bullish case. Instead, I am staying on volatility watch.
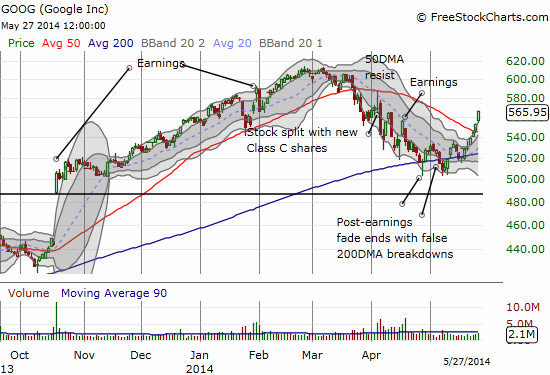
Finally, to make reading the tea leaves even more difficult, I end with this nice breakout for Google (GOOG) that technically tells me to buy the dip often and aggressively… (this is one I really should have nailed after I pointed out the critical nature of the 200DMA test.)
Daily T2108 vs the S&P 500
")
Black line: T2108 (measured on the right); Green line: S&P 500 (for comparative purposes)
Red line: T2108 Overbought (70%); Blue line: T2108 Oversold (20%)
Weekly T2108

*All charts created using freestockcharts.com unless otherwise stated
Related links:
The T2108 Resource Page
Expanded daily chart of T2108 versus the S&P 500
Expanded weekly chart of T2108
Be careful out there!
Full disclosure: long SSO puts, long QID calls, long AAPL shares, short NFLX shares, long NFLX call spread, long FUEL
On Monday, May 27, stocks continued risk-on as Global Financials, IXG, traded higher, but remains below its recent high. The National Bank of Greece, NBG, and Spain’s Banco Santander, SAN, led European Financials, EUFN, and the Speculative Leveraged Investment Community, that is Stockbrokers, IAI, Regional Banks, KRE, Investment Bankers, KCE, Too Big To Fail Banks, RWW, Insurance Companies, KIE, FNF, FNHC, UIHC, AFH, AFSI, AHL, and Life Insurance Companies, PUK, putting in the likely top in a global recovery rally of the European Financials, EUFN, as well as the Emerging Market Stocks, EEM, EWX.
World Stocks, VT, rose to a new rally high, manifesting the three grand finale soldiers salute candlestick pattern, with the credit sensitive sectors rallying strongly; these included Small Cap Industrial, PSCI, Small Cap Pure Growth, RZG, and Small Cap Pure Value, RZV. The trade higher in Retailers and Credit Services, communicates the completion of rally of the credit sensitive sectors.
The Eurozone Nations, Italy, EWI, Greece, GREK, and Spain, EWP, as well as the Eurozone Stocks, EZU, led Nation Investment, EFA, and Small Cap Nation Investment, SCZ, higher, in what is likely a blow off market top, on the recovery of investor sentiment from credit fears in Europe, as well as the United States, and on the recovery of the emerging market debt, EMB, EMLC, EMCD, and the emerging market currencies, CEW, such as the Brazilian Real, BZF, and the Indian Rupe, ICN.
Nations trading lower on competitive currency devaluation at the hands of the currency traders included South Africa, EZA, Russia, RSX, ERUS, New Zealand, ENZL, South Korea, EWY, as well as Emerging Europe, ESR, Emerging Africa, GAF, Turkey, TUR, Brazil, EWZ, EWZS, India, INP, SCIN, Columbia, GXG, and Indonesia, IDX.
Emerging Market Infrastructure, EMIF, such as CIG, ELP, KEP, HNP, EBR, EOC, CPL, EDN, Brazil Financials, BRAF, and India Earnings. EPI, led Emerging Market Financials, EMFN, lower, on the trade lower in the Emerging Market Currencies, CEW, with the Brazilian Real, BZF, and the India Rupe, ICN, trading lower.
One can follow the collapse of Emerging Markets, EEM, such as EGPT, SCIN, IDX, GAF, GXG, EWZS, TUR, with the assistance of this Finviz Screener of the Most Carry Traded Nations.
Most Yield Bearing Investments, traded higher; these included Premium REITS, KBWY, such as MIC, BKD, and SBAC, and Shipping, SEA, such as CMRE, KEX, TK, BALT.
Apple, AAPL, traded higher, leading Dividends Excluding Financials, DTN, to a new rally high.
Emerging Market Infrastructure, EMIF, traded lower on derisking out of currency carry trade and debt trade investments in India and Brazil; and Energy Partnerships, AMJ, traded lower, evidencing that the investor, specifically the fixed income investor is going extinct, on the failure of trust in the world central banks’ monetary authority.
Debt deflation is seen in Major World Currencies, DBV, and Emerging Market Currencies, CEW, now both trading lower; and is driving Global Energy Producers, IPW, FILL, lower; these include South Africa’s SSL, Brazil’s PBR, China’s SNP, Canada’s CNQ, SU, ECA, Argentina’s YPF, The UK’s BP, Europe’s RDS-B, US’s HES, CVX; their trade lower reflects the death of currencies and the failure of credit.
The chart of the Interest Rate, ^TNX, shows a trade lower to 2.52%; with strong support seen lower at 2.49%. Aggregate Credit, AGG, traded up to its May 15, 2014, high, and was led higher by 30 Year US Government Bonds, EDV, and US Treasuries, TLT. Junk Bonds, JNK, traded just slightly higher than is all time high that occurred on May 16, 2014.
Gold, GLD, and Silver, SLV, and Agricultural Commodities, RJA, traded strongly lower, leading commodities, DBC, lower. Spot Gold, $GOLD, traded lower to find support at $1,260.
That’s quite an extensive report! Thanks for posting.