
(T2108 measures the percentage of stocks trading above their respective 40-day moving averages [DMAs]. It helps to identify extremes in market sentiment that are likely to reverse. To learn more about it, see my T2108 Resource Page. You can follow real-time T2108 commentary on twitter using the #T2108 hashtag. T2108-related trades and other trades are posted on twitter using the #120trade hashtag)
T2108 Status: 54.3%
VIX Status: 11.9
General (Short-term) Trading Call: Short (fade rallies, especially in tech).
Active T2108 periods: Day #220 over 20%, Day #72 over 40%, Day #25 over 50% (over-period), Day #5 under 60% (under-period), Day #32 under 70%
Reference Charts (click for view of last 6 months from Stockcharts.com):
S&P 500 or SPY
SDS (ProShares UltraShort S&P500)
U.S. Dollar Index (volatility index)
EEM (iShares MSCI Emerging Markets)
VIX (volatility index)
VXX (iPath S&P 500 VIX Short-Term Futures ETN)
EWG (iShares MSCI Germany Index Fund)
CAT (Caterpillar).
Commentary
T2108 closed at 54.3% as part of five days of tight churn. The S&P 500 (SPY) has similarly churned but maintains an upward bias supported loosely by the 50-day moving average (DMA).
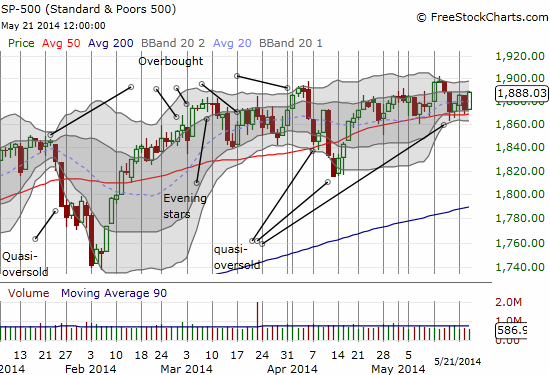
This slow and steady creep higher is also ever so slowly withering away my conviction that mid-March marked a lasting high for the S&P 500. Each month since then has featured a short and temporary burst above those March highs. The third time could be a charm.
BUT, I cannot help but keep a wary eye on volatility. The VIX closed at 11.9, a closing level last seen in early August, 2013. The VIX could certainly go even lower, but it is essentially running out of room here at the lows of the trading range in place since late 2012/early 2013. A bounce from these levels should be accompanied by selling.
Click for a larger image…
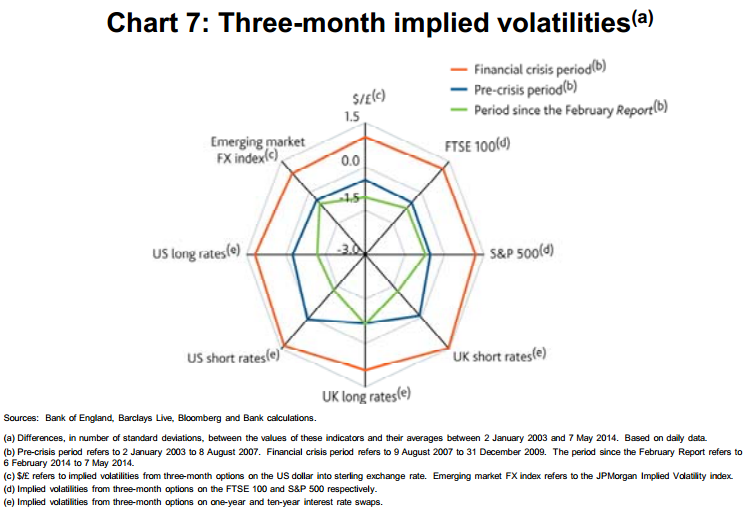
Source: “The future of monetary policy” by Charlie Bean, Deputy Governor for Monetary Policy, Bank of England.
BUT, T2108 is now not even close to overbought levels. So, I cannot get overly bearish just yet. (Do not forget that the length of time T2108 has spent above 20%, the oversold threshold, suggests that the sell-off that finally takes T2108 back to oversold levels will be relatively shallow). A combination of low volatility and overbought conditions SHOULD trigger a brighter red sell flag. Stay tuned on that one.
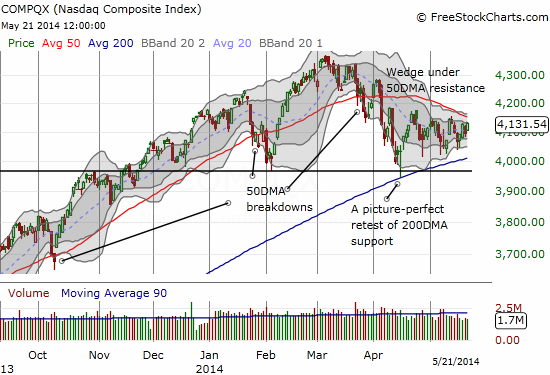
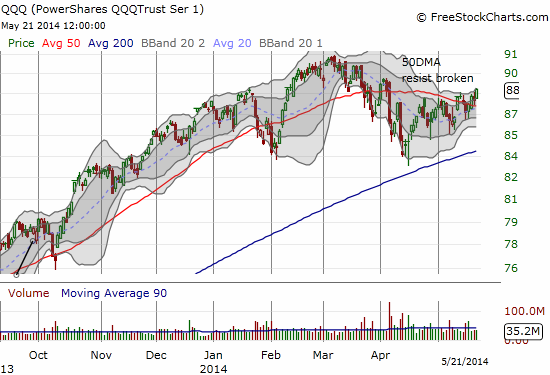
In the meantime, the PowerShares QQQ (QQQ) is breaking free from 50DMA resistance even as the full NASDAQ remains stuck in a wedge pattern that could still break either way.
Hanging in the balance are so-called momentum stocks. Since I wrote “A Looming Cessation of Hostilities for Momentum Stocks?” on May 9th, it seems that the selling in these names has indeed started drying up. This action further confounds my preference to maintain a bearish bias. I do not think any of the momentum stocks I am actively following have hit new lows in the past two weeks or so. Some, like Netflix (NFLX), are rising like the legendary Phoenix form the ashes of momentum turned upside down.
This extending reprieve for momentum stocks is showing up in several ways like sharp rallies and critical support levels holding. It is easiest to tell this story with pictures. I sprinkle in some other views as well.
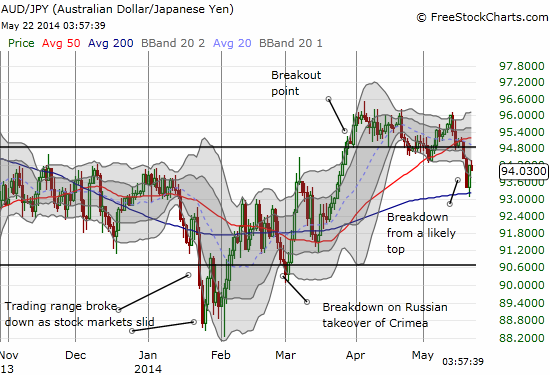
First, the Australian dollar versus the Japanese yen (AUD/JPY). I am still using this currency pair as my final arbiter of risk appetite. I interpreted the recent breakdown as confirmation of a looming sell-off given low volatility levels. As it turns out, the technicals forced a pause on such bearish sentiment. Like “magic”, AUD/JPY bounced smartly off its 200DMA. The confirmation of a breakdown will have to wait another day (or week).
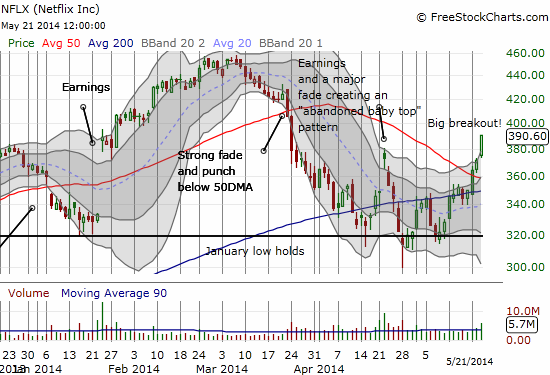
Now, back to Netflix (NFLX). I am TRULY kicking myself double on this one.
I was flat out wrong in converting from a bull to a bear (still smarting from misplaying the initial post-earnings bounce no doubt). In just the four trading days since then, NFLX is up a smart 13.5%. It surged off its 200DMA, blasted right through 50DMA resistance, and for good measure closed today at a fresh post-earnings high. I did not even imagine any of these moves happening, at least not THIS soon.
I interpreted the massive post-earnings fade as a sign that NFLX had truly lost its momo mojo. I compounded my error by taking a short at 50DMA resistance. If I were not already biased bearish, I might have seen the very bullish developments underway. Belatedly, I got back into a bullish call spread as a hedge. I positioned my short for risk up to $400 although I definitely did not think at the time that $400 was even a remote possibility!
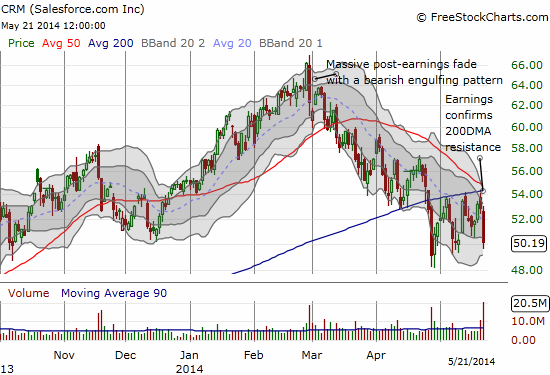
Salesforce.com (CRM) reported earnings on Tuesday night. The market reacted poorly. The technicals though are exactly what I would expect with the 50DMA crashing down on the 200DMA: a convergence of stiff resistance. Note how well the 200DMA has held as resistance even as CRM made a series of higher lows. A break of the $48 level will confirm bearishness.
Like many momentum stocks, the top occurred in dramatic fashion. CRM was an early victim of the death of momentum. The biggest irony of CRM’s top is that it came after reporting earnings that seemed uniformly liked by analysts. Briefing.com lists a whole host of firms reiterating bullish opinions, upgrading, and/or increasing price targets. You cannot get a clearer top than price action directly and loudly contradicting analyst consensus.
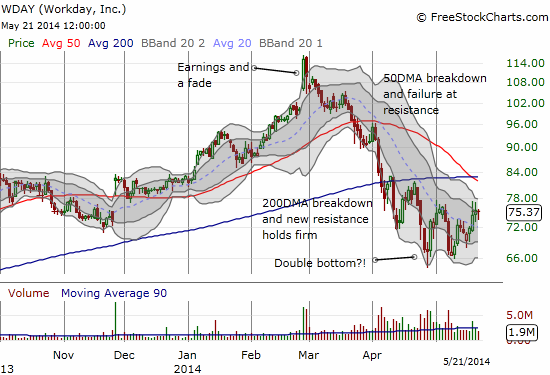
Here is Workday (WDAY) in the same 50/200DMA predicament. It recently broke through the primary downtrend from the 20DMA. Given the experience with NFLX, I am now eyeing the successful retest of lows as a potential double-bottom.
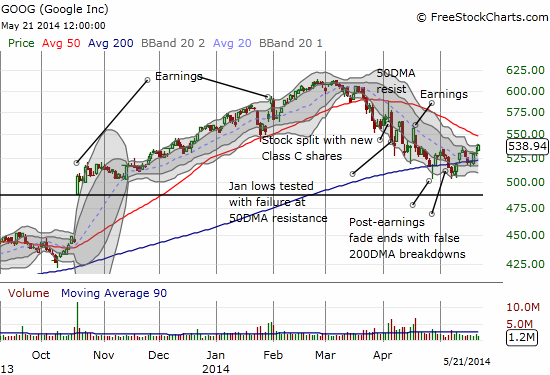
Starting to look like Google’s (GOOG) retest of its 200DMA will succeed. I wish the call option I bought last week expired THIS week.
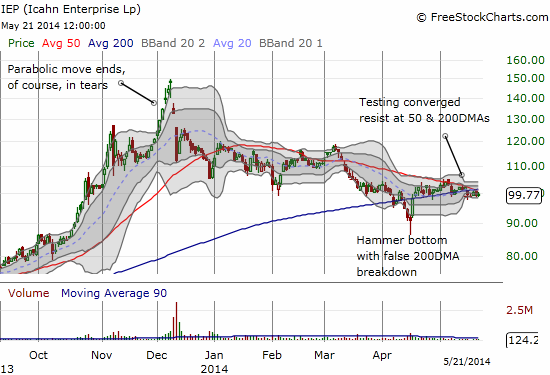
Icahn Enterprise (IEP) broke below its 200DMA in mid-April but quickly formed a nice hammer bottom. The next test is here with perfect convergence of 50 and 200DMA resistance.
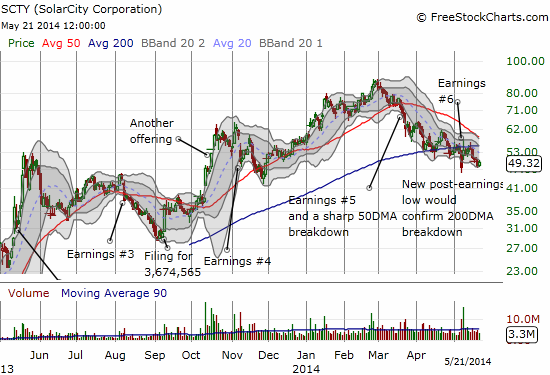
Solar City (SCTY) is a strange one. I have managed to sell puts for profits twice against a small position I opened after the stock faded a bit post-earnings. Turns out the 200DMA is holding firm as resistance making more ominous the quick decline in the 50DMA. SCTY plunged ahead of earnings, popped as high as 20% the day after earnings, and has now essentially erased all its post-earnings gains. I may be buying puts again real soon…
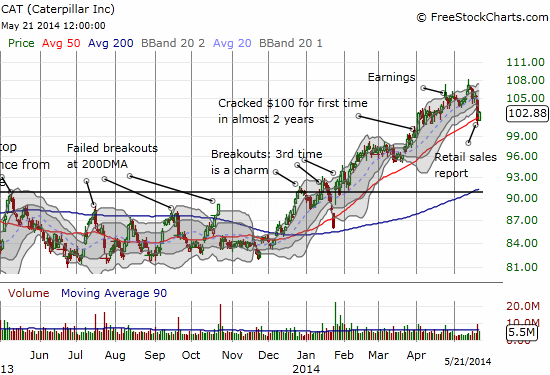
Caterpillar (CAT) has recently become the anti-momentum momentum stock – CAT has taken on a life of its own. CAT has yet to make a new all-time high since early 2012, but it has sprinted upward in 2014 for a 13.3% gain. This gain has come through some turbulent trading including a large gap down in January and now a poor response to the May retail sales report. Both episodes challenged the 50DMA. I rushed in with puts after the sales report with the original intention to refresh a hedge. I decided to lock in profits as the stock hurtled through the 50DMA. Wednesday’s bounce seemed to validate my suspicion that CAT might snap back as sharply as it plunged. Still, I am looking to get right back into puts. If CAT has finally topped out here, a subsequent slide could be as persistent as the ride up.
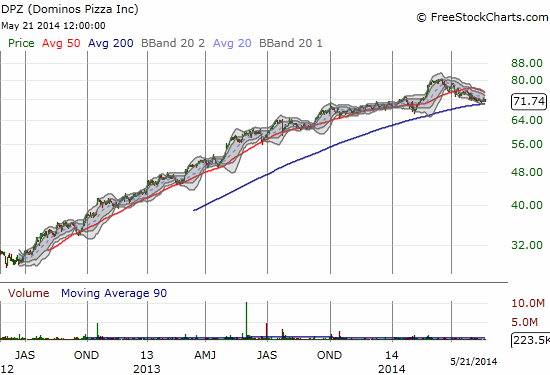
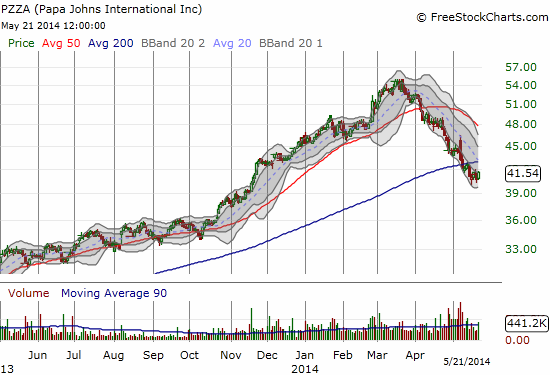
I recently discovered that Papa Murphy’s (FRSH) managed to go IPO on May 2nd. Talk about bad timing. The stock priced at $11, the low end of a 11-13 price range. It opened at $12 and has sold off ever since. Only TWO up days in its short life. It made me look at the charts of other pizza joints: Domino’s (DPZ) and Papa John’s (PAPA). The run-up in pizza makes it clear why FRSH figured it could do well in a me-too IPO. Who knew even pizza could turn on the momentum jets? DPZ is still holding above its 200DMA while PZZA has truly broken down, off 24% from its all-time high. That new special sauce must really work wonders for DPZ.
“Sell in May” has essentially turned into “Stabilize in May” as fresh breakdowns are no longer easy to find. Recall three key lessons for May: 1) tops tend to occur in the beginning and end of the month; 2) the summer is typically a great time to trade with the market often returning to the May high; 3) the summer is typically mild for the S&P 500 but when it is is bad it is REALLY bad.
Daily T2108 vs the S&P 500
")
Black line: T2108 (measured on the right); Green line: S&P 500 (for comparative purposes)
Red line: T2108 Overbought (70%); Blue line: T2108 Oversold (20%)
Weekly T2108

*All charts created using freestockcharts.com unless otherwise stated
Related links:
The T2108 Resource Page
Expanded daily chart of T2108 versus the S&P 500
Expanded weekly chart of T2108
Be careful out there!
Full disclosure: long SSO puts, long QID calls, long AAPL shares, short NFLX shares, long NFLX puts and call spread, short WDAY, long SCTY, long CAT, net short Australian dollar