
(T2108 measures the percentage of stocks trading above their respective 40-day moving averages [DMAs]. It helps to identify extremes in market sentiment that are likely to reverse. To learn more about it, see my T2108 Resource Page. You can follow real-time T2108 commentary on twitter using the #T2108 hashtag. T2108-related trades and other trades are posted on twitter using the #120trade hashtag)
T2108 Status: 66.4%
VIX Status: 12.9
General (Short-term) Trading Call: Hold (bullish bias)
Active T2108 periods: Day #128 over 20%, Day #3 over 60% (overperiod), Day #43 under 70%
Reference Charts (click for view of last 6 months from Stockcharts.com):
S&P 500 or SPY
SDS (ProShares UltraShort S&P500)
U.S. Dollar Index (volatility index)
EEM (iShares MSCI Emerging Markets)
VIX (volatility index)
VXX (iPath S&P 500 VIX Short-Term Futures ETN)
EWG (iShares MSCI Germany Index Fund)
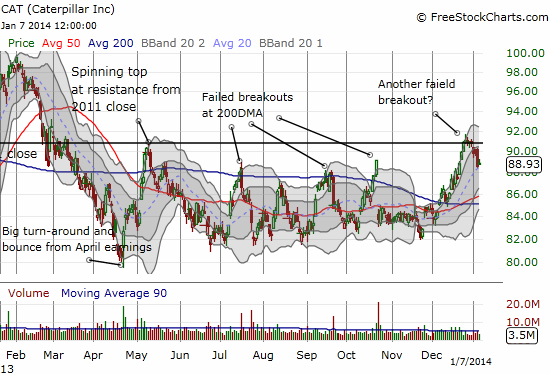
CAT (Caterpillar)
Commentary
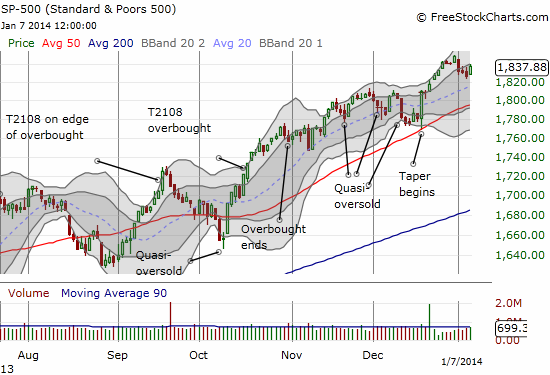
Maybe T2108 will start the year overbought after all…just a few days late. T2108 closed the day at 66.4%, its highest close in two months. One more strong day on the S&P 500 (SPY) could push my favorite technical indicator into overbought territory (70% and above). The small push in the index ended a small three-day losing streak.
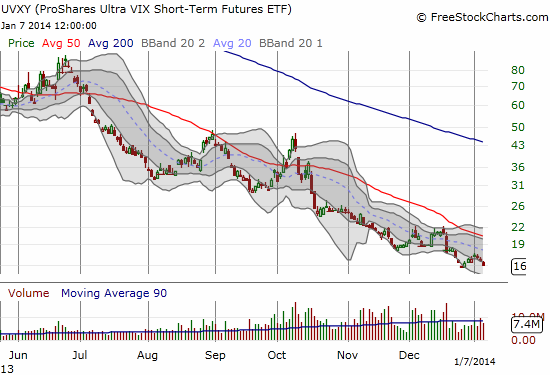
As a result of the new push, the volatility index has pushed downward again. In particular, ProShares Ultra VIX Short-Term Futures ETF (UVXY) has turned downward yet again. This time, the previous rally was very short-lived. The persistent downtrend in UVXY has made it one of my favorite ways (short) to play a bullish bias in the general stock market.
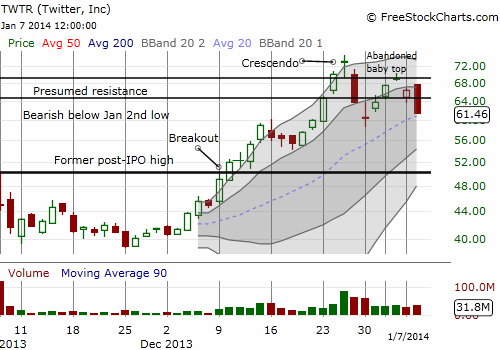
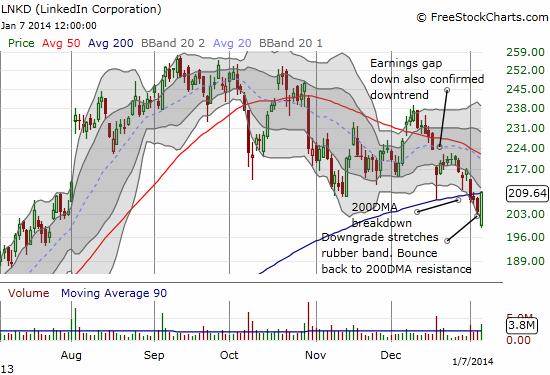
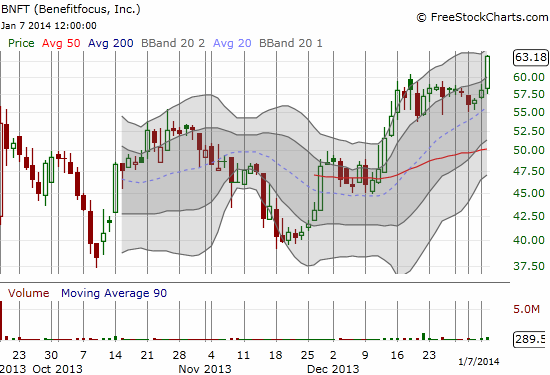
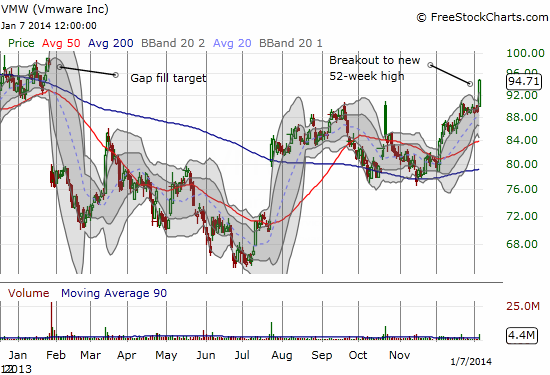
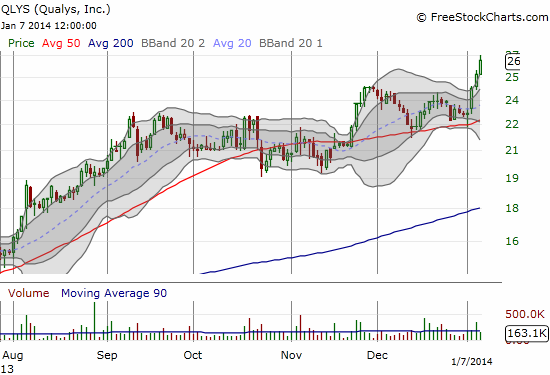
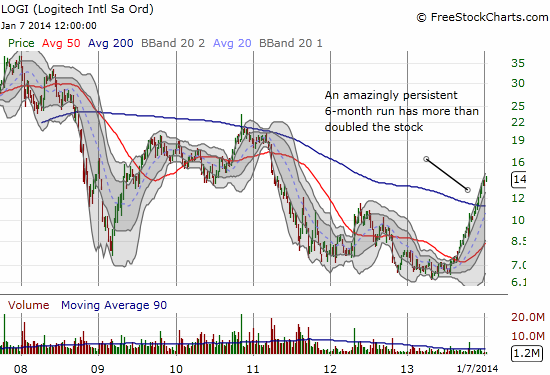
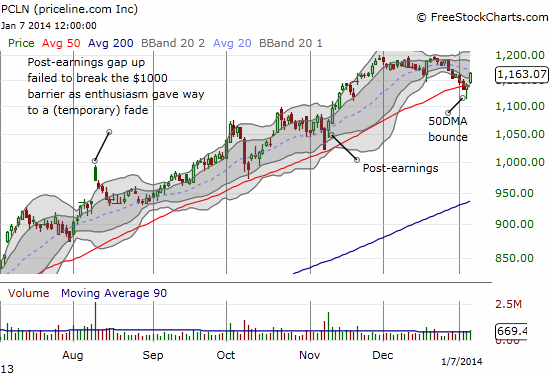
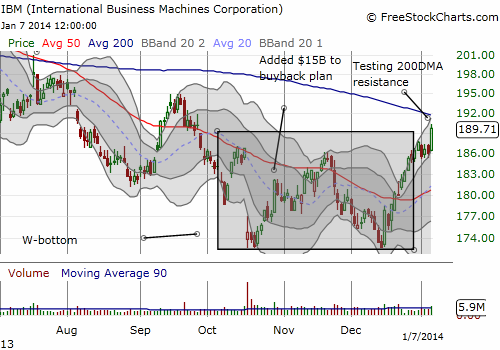
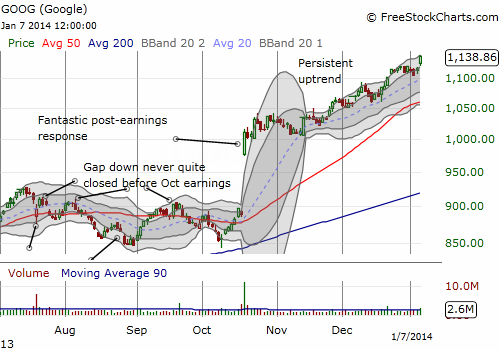
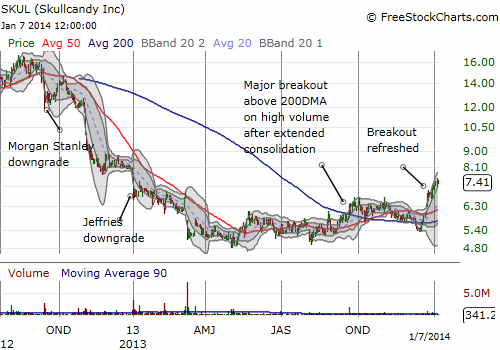
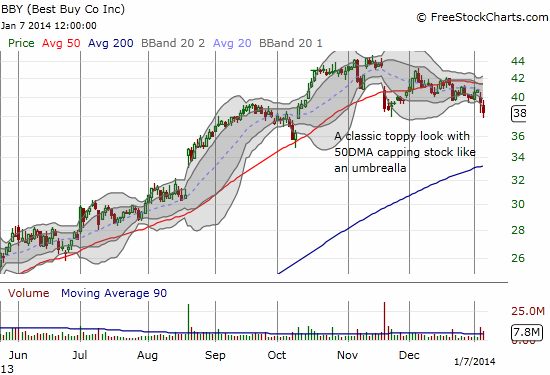
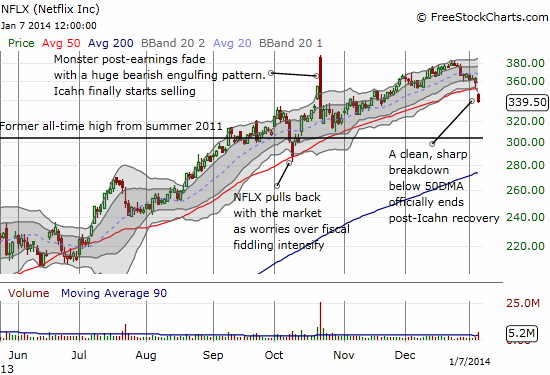
While we wait for overbought, here is a cornucopia of charts that I hope mainly speak for themselves. Some of them are follow-ups from previous posts. Most represent strong uptrends and nice breakouts. A few demonstrate tops in the making and red flag breakdowns. A few show important tests of resistance in the making or failed. If you have any questions on why I posted any of these charts or what they mean, feel free to ping me through the comments section.
Daily T2108 vs the S&P 500
")
Black line: T2108 (measured on the right); Green line: S&P 500 (for comparative purposes)
Red line: T2108 Overbought (70%); Blue line: T2108 Oversold (20%)
Weekly T2108

*All charts created using freestockcharts.com unless otherwise stated
Related links:
The T2108 Resource Page
Expanded daily chart of T2108 versus the S&P 500
Expanded weekly chart of T2108
Be careful out there!
Full disclosure: long SPHB and SPLV and SSO puts (pairs trade); long CAT, SKUL; short BBY, NFLX, LNKD; long puts on LNKD, TWTR, UVXY