
(T2108 measures the percentage of stocks trading above their respective 40-day moving averages [DMAs]. It helps to identify extremes in market sentiment that are likely to reverse. To learn more about it, see my T2108 Resource Page. You can follow real-time T2108 commentary on twitter using the #T2108 hashtag. T2108-related trades and other trades are posted on twitter using the #120trade hashtag)
T2108 Status: 68.6%
VIX Status: 12.9
General (Short-term) Trading Call: Hold (bullish bias)
Active T2108 periods: Day #131 over 20%, Day #6 over 60% (overperiod), Day #46 under 70%
Reference Charts (click for view of last 6 months from Stockcharts.com):
S&P 500 or SPY
SDS (ProShares UltraShort S&P500)
U.S. Dollar Index (volatility index)
EEM (iShares MSCI Emerging Markets)
VIX (volatility index)
VXX (iPath S&P 500 VIX Short-Term Futures ETN)
EWG (iShares MSCI Germany Index Fund)
CAT (Caterpillar)
Commentary
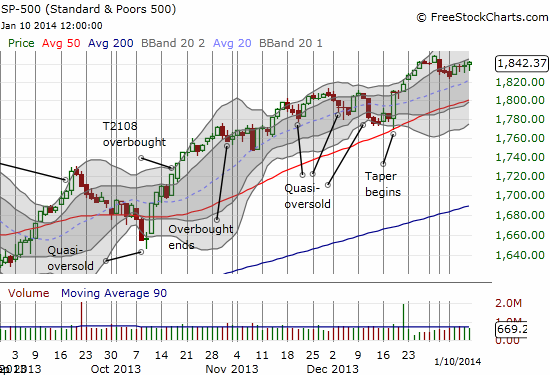
The Friday U.S. jobs report may have disappointed but T2108 kept creeping higher. It closed the day just a hair from overbought status at 68.6%. The S&P 500 closed just a few points higher in the middle of a pattern that looks ripe for launch. In the chart below, notice how the steady creep higher (ever so slowly!) and the inability of the sellers to keep control of the close the last three days.
The VIX had the biggest move; it lost 5.8% to its lowest close since early August. I still hold the latest tranche of puts on ProShares Ultra VIX Short-Term Futures ETF (UVXY) in anticipation of at least one more swoosh downward before volatility finds some kind of (short-term?) bottom. UVXY closed at a fresh all-time low.
For bears, particularly once/if T2108 hits overbought, the current pattern also provides a definitive trigger for shorts. A close below the recent low around 1823 would set up tough overhead resistance in the current pattern. This provides for a higher shorting point than the previous trigger of the round number 1800. Note that 1800 is now right at the critical 50DMA uptrend.
While we wait for developments to unfold, here is a technical update on LinkedIn (LNKD), Apple (AAPL), and Intercept Pharmaceuticals (ICPT).
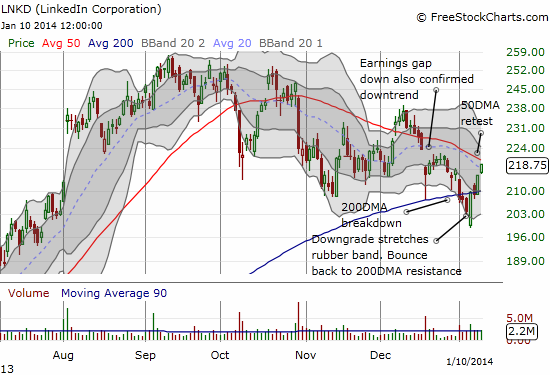
LNKD did not play the victim for long and quickly recovered from its recent breakdown below its 200DMA. This is a powerful pattern given the bullish engulfing pattern that took LNKD back to the 200DMA after a downgrade extended the breakdown. LNKD now stands a few points away from the primary 50DMA downtrend. If previous 50DMA tests are any indicator, LNKD will slice through this resistance but lose altitude soon thereafter. I have already started positioning short. A move above $240, the December high, would pretty much end the shorting opportunity.
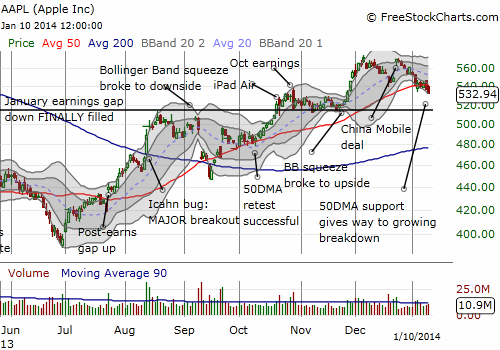
It seems like AAPL requires a daily vigil. Friday’s close was a small loss but an important technical signal. It extended the current downtrend and made a new (marginal) 6-week low. The retest of the 50DMA is starting to look like a breakdown in the making. At the current rate, I am expecting a retest of the top of the January, 2013 earnings gap down before this month’s earnings. For Monday, the Apple Trading Model (ATM) produced a 57% chance of an up close. 50/50 for gains from the open. Hardly a ringing endorsement, so I do not expect the typical Monday slingshot higher. The ATM absolutely nailed the trading on Thursday and Friday.
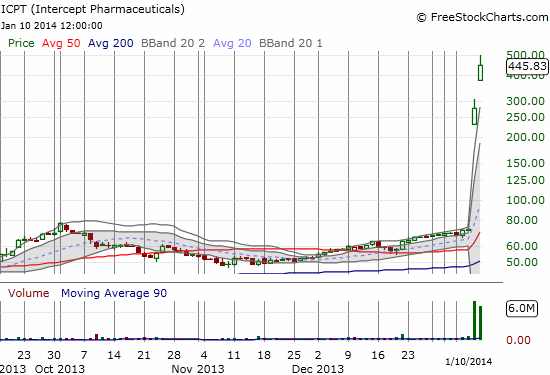
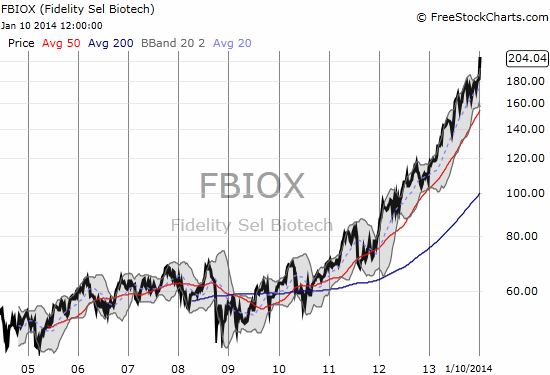
I am posting ICPT just because I feel like I need to record this chart! It is a chart for the ages. Supposedly, Thursday’s 281% one-day gain is the largest on record for a stock (I am assuming that excludes bulletin board and pink sheet stocks). Incredibly, ICPT gained another 62% on Friday! Shorts were 13.3% of the float as of December 31, 2013. That is some MAJOR pain. Amongst the major holders of ICPT is the mutual fund Fidelity Select Portfolios – Biotechnology (FBIOX). As of November 30, 2013, the fund held 1.3M shares, amounting to 6.8% of ICPT’s stock ownership. FBIOX has gained 9.6% in two days thanks to ICPT, but this is just icing on the cake of a major three-year breakout and run-up.
For more info on ICPT, check out the analyst on Nightly Business Report for January 9, 2014. You can fast forward to the 16:48 point….
Daily T2108 vs the S&P 500
")
Black line: T2108 (measured on the right); Green line: S&P 500 (for comparative purposes)
Red line: T2108 Overbought (70%); Blue line: T2108 Oversold (20%)
Weekly T2108

*All charts created using freestockcharts.com unless otherwise stated
Related links:
The T2108 Resource Page
Expanded daily chart of T2108 versus the S&P 500
Expanded weekly chart of T2108
Be careful out there!
Full disclosure: long SPHB and SPLV and SSO puts (pairs trade), long UVXY puts, short LNKD, long LNKD put spread and calls, long AAPL shares and puts