
(T2108 measures the percentage of stocks trading above their respective 40-day moving averages [DMAs]. It helps to identify extremes in market sentiment that are likely to reverse. To learn more about it, see my T2108 Resource Page. You can follow real-time T2108 commentary on twitter using the #T2108 hashtag. T2108-related trades and other trades are posted on twitter using the #120trade hashtag)
T2108 Status: 53.6
VIX Status: 13.9
General (Short-term) Trading Call: Stay short. If not already short, try to fade a bounce.
Active T2108 periods: Day #93 over 20% (overperiod), Day #1 under 60% (underperiod), Day #6 under 70%
Reference Charts (click for view of last 6 months from Stockcharts.com):
S&P 500 or SPY
SDS (ProShares UltraShort S&P500)
U.S. Dollar Index (volatility index)
EEM (iShares MSCI Emerging Markets)
VIX (volatility index)
VXX (iPath S&P 500 VIX Short-Term Futures ETN)
EWG (iShares MSCI Germany Index Fund)
CAT (Caterpillar)
Commentary
In the last T2108 Update, I described a strange and unexpected divergence between a sinking T2108 and a resilient S&P 500 (SPY). I refrained from calling it a bearish divergence because I have been fooled in the past. This time, it was a bearish divergence of major proportions.
The S&P 500 dropped 1.2% on the day. This move in itself is not huge. However, I discussed earlier that the S&P 500 recently has typically experienced significant pullbacks once T2108 falls from overbought status. In THAT sense, today’s long overdue drop is huge as it could confirm that a significant pullback is finally underway. The chart below shows how dramatic today’s action looks compared to the numerous days where the S&P 500 has barely budged over the last two weeks or so.
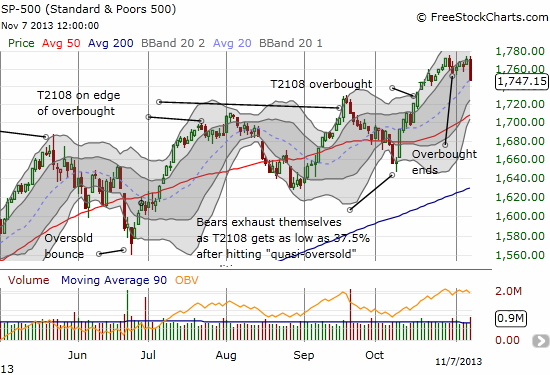
The potential lesson here for me is that a bearish divergence is likely defined relative to T2108’s position in the cycle. I will have to check out the historical data on this theory, but I strongly suspect that bearish divergences are more important when the historical data suggest that the S&P 500 should be in decline, like now.
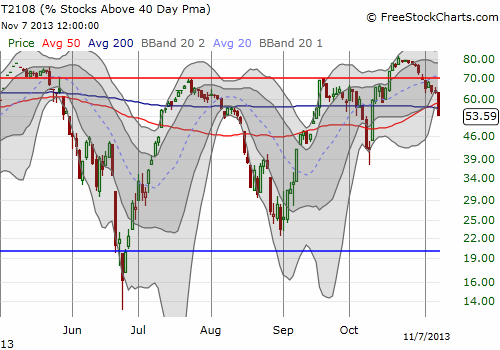
T2108 took a deep plunge. The chart below shows how the drip-drip-drip over the past week or so led to today’s big swoosh.
If this move caught you before you could get short, I recommend trying to target a fade to initiate a short. If the S&P 500 experiences follow-through selling on Friday (Nov 8th), then I will be watching out for a quasi-oversold bounce. I will be ready with the TTM (T2108 Trading Model) in that case to assess the odds of a 1-day bounce.
Overall, the S&P 500’s drop makes shorting the market much easier. Bears can stay biased short with a stop at a new all-time high for the S&P 500; Thursday’s plunge from the sky puts the burden of proof on the buyers. My strong suspicion is that a new all-time high will NOT be happening for quite some time; oversold conditions should come before the next overbought conditions. As always, time will tell.
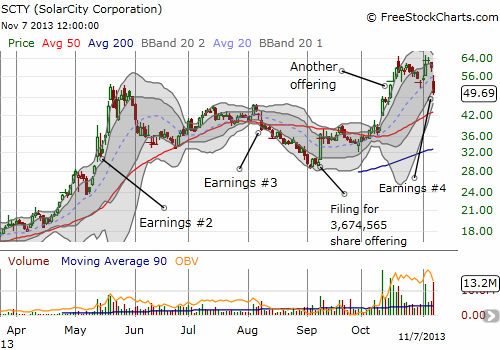
I will end by wrapping up the pre/post-earnings discussion for Solar City (SCTY). With hindsight, I see that I should have stayed focused on shorting opportunities given my overall bearish bias on the market. Fortunately, most of my other trades have been firmly bearish, but I could not resist what I saw as bullish signals all over the SCTY trade. In fact, if not for today’s market sell-off, I think SCTY could have experienced a sustained bounce. Instead, SCTY’s two attempts at a bounce were met by eager sellers.
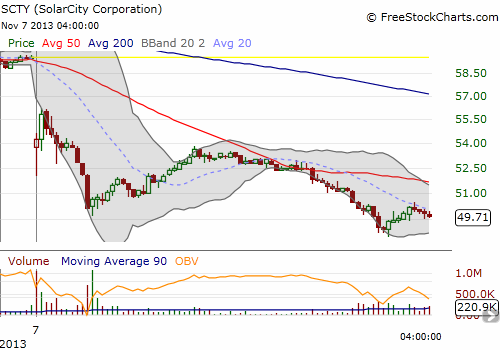
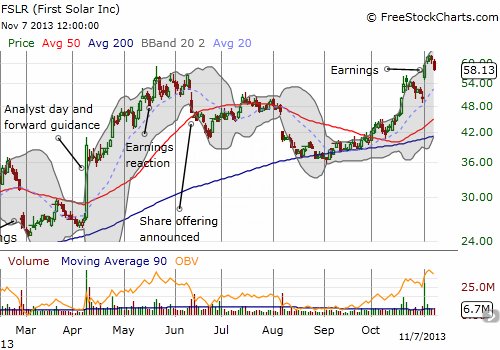
As planned, I sold short a December put into the selling (and lucked out that I was patient in doing so). Obviously, it would have been better to BUY a put at the open but at that time I thought I was going to miss an opportunity to sell a put at a good premium. It was hard watching the position go from green to red as the day came to a close, but I am sticking with it for a while. I happen to have a short in First Solar (FSLR) that looks like a good enough hedge here. (I am looooong overdue for a post on the solar plays!).
Daily T2108 vs the S&P 500
")
Black line: T2108 (measured on the right); Green line: S&P 500 (for comparative purposes)
Red line: T2108 Overbought (70%); Blue line: T2108 Oversold (20%)
Weekly T2108

*All charts created using freestockcharts.com unless otherwise stated
Related links:
The T2108 Resource Page
Expanded daily chart of T2108 versus the S&P 500
Expanded weekly chart of T2108
Be careful out there!
Full disclosure: long SSO puts, short SCTY put, short FSLR shares