
(T2108 measures the percentage of stocks trading above their respective 40-day moving averages [DMAs]. It helps to identify extremes in market sentiment that are likely to reverse. To learn more about it, see my T2108 Resource Page. You can follow real-time T2108 commentary on twitter using the #T2108 hashtag. T2108-related trades and other trades are posted on twitter using the #120trade hashtag)
T2108 Status: 48.9%
VIX Status: 13.4
General (Short-term) Trading Call: Aggressive traders should stay short. Stop out on S&P 500 follow-through above 1800. T2108 Trading Model (TTM) generates 68% chance of an up day for November 21st based on quasi-oversold conditions.
Active T2108 periods: Day #102 over 20% (overperiod), Day #1 under 50% (underperiod), Day #10 under 60%, Day #15 under 70%
Reference Charts (click for view of last 6 months from Stockcharts.com):
S&P 500 or SPY
SDS (ProShares UltraShort S&P500)
U.S. Dollar Index (volatility index)
EEM (iShares MSCI Emerging Markets)
VIX (volatility index)
VXX (iPath S&P 500 VIX Short-Term Futures ETN)
EWG (iShares MSCI Germany Index Fund)
CAT (Caterpillar)
Commentary
The S&P 500 (SPY) ended last Friday with its sixth straight week delivering upside to investors.
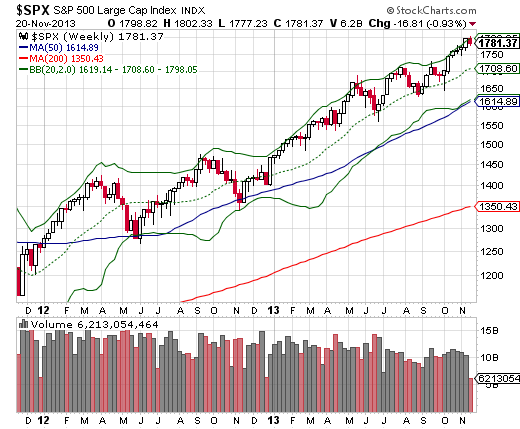
Source: StockCharts.com
The chart above is a handy reminder of what the bears are up against when trying to fade this market. While the recent six-week up-streak was noteworthy, it was not surprising given this strong uptrend. What IS surprising is that once again, T2108 is plunging while the S&P 500 is not also selling off hard. In three days, T2108 has fallen 16% while the S&P 500 is off only -0.9%. At least the index IS moving downward. When T2108 plunged for over a week recently, the S&P 500 barely moved at all until a one-day sell-off on November 7th. Sellers quickly exhausted themselves and buyers had no trouble reversing the losses. It only took a day.
I failed to examine November 7th’s drop as a quasi-oversold condition. This time, I am ready. I even updated the historical data through November 13, 2013 (long overdue!). With T2108 dropping 14% over the past two days, the T2108 Trading Model (TTM) generates a 68% chance that the S&P 500 will close up tomorrow (November 21, 2013). Interestingly, the data refresh finally brings a condition on the S&P 500’s position relative to its 200DMA. If the S&P 500 were trading BELOW the 200DMA, with all else being equal, the TTM would have generated an 87% chance of a DOWN day. This differentiation according to technicals is what I originally expected when I first constructed the TTM. It is reassuring to see this condition finally appear. There are no branches in the classification tree for position relative to the 20 or 50DMAs.
I continue to watch closely the on-going selling in the high-flyers of the stock market. See my last T2108 Update for examples. Also, Bespoke Investments quantified the sell-off by slicing up the Russell 1000 into deciles and showing the differentiated performance in the past two weeks versus year-to-date (see “2013’s Big Winners Having A Rough Week“).
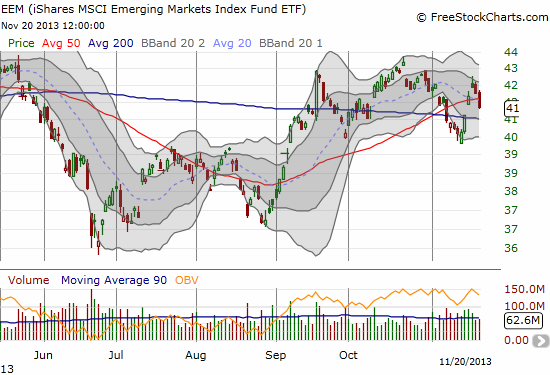
The sudden weakness in highly speculative stocks will likely continue, maybe even accelerate, given tapering fears have reignited in the stock market. The yield on the 10-year Treasury soared today from 2.71% to 2.79% in the wake of the minutes from the last Fed meeting. One of my favorite plays in this volatile rate environment remains a straddle or strangle on iShares MSCI Emerging Markets (EEM). EEM printed another short setup yesterday and today cracked below its 50DMA again. I think this ETF is topping out…if you look closely, you might even recognize a head and shoulders top in the making.
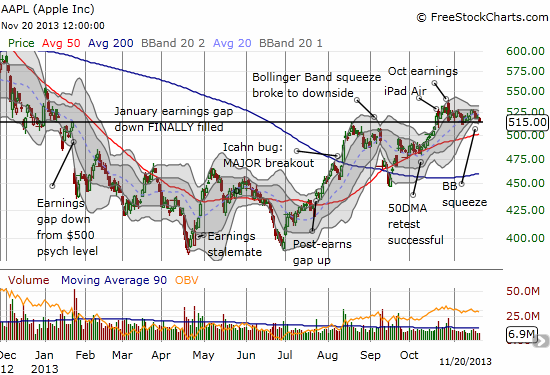
I end by pointing out that Apple (AAPL) is on the edge of confirming my warning of a downward resolution to a Bollinger Band squeeze. AAPL closed exactly at $515 today which is the support from the January post-earnings gap down. Crack through this, and AAPL will easily retest its 50DMA support which just so happens to rest right around $500…
Piecing all these signals together, I am looking through Thursday’s likely upside to an important and critical juncture with Black Friday. I continue to think that season will serve as a “last stand” for bears to get some real selling going. Until then, I am being very opportunistic in shorting stocks and will use a rally on Thursday to look for new short candidates. I have NOT yet expanded my small tranche of SSO puts. I still prefer to wait for overbought conditions before doing so.
Daily T2108 vs the S&P 500
")
Black line: T2108 (measured on the right); Green line: S&P 500 (for comparative purposes)
Red line: T2108 Overbought (70%); Blue line: T2108 Oversold (20%)
Weekly T2108

*All charts created using freestockcharts.com unless otherwise stated
Related links:
The T2108 Resource Page
Expanded daily chart of T2108 versus the S&P 500
Expanded weekly chart of T2108
Be careful out there!
Full disclosure: long SSO puts; long AAPL shares; long AAPL put spread