
(T2108 measures the percentage of stocks trading above their respective 40-day moving averages [DMAs]. It helps to identify extremes in market sentiment that are likely to reverse. To learn more about it, see my T2108 Resource Page. You can follow real-time T2108 commentary on twitter using the #T2108 hashtag. T2108-related trades and other trades are posted on twitter using the #120trade hashtag)
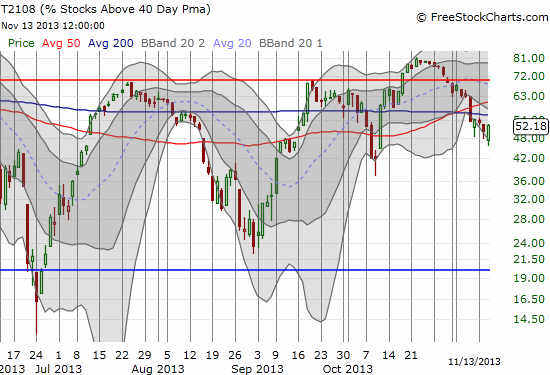
T2108 Status: 52.2
VIX Status: 12.5
General (Short-term) Trading Call: Consider stopping out of shorts.
Active T2108 periods: Day #97 over 20% (overperiod), Day #5 under 60% (underperiod), Day #10 under 70%
Reference Charts (click for view of last 6 months from Stockcharts.com):
S&P 500 or SPY
SDS (ProShares UltraShort S&P500)
U.S. Dollar Index (volatility index)
EEM (iShares MSCI Emerging Markets)
VIX (volatility index)
VXX (iPath S&P 500 VIX Short-Term Futures ETN)
EWG (iShares MSCI Germany Index Fund)
CAT (Caterpillar)
Commentary
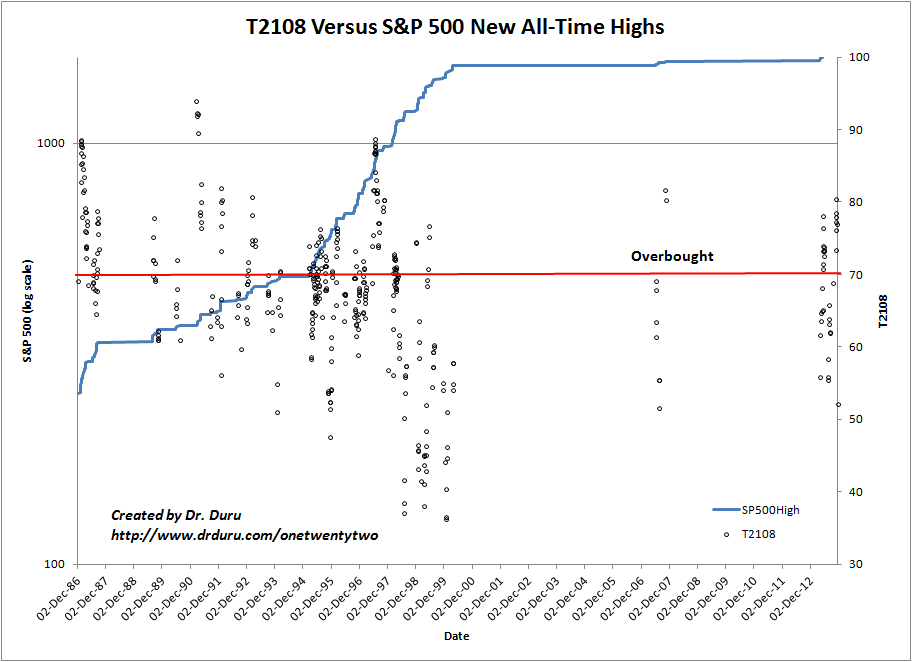
In the March 18, 2013 T2108 Update, I prepared readers for the inevitability of new all-time highs for the S&P 500 (SPY) by reviewing the recent history of all-time highs. As it turned out, the S&P 500 made new all-time highs in another 10 calendar days. More importantly, at that time, I made the surprising discovery that T2108 tends NOT to be overbought when the S&P 500 first makes new all-time highs. In fact, the history of new all-time highs demonstrates a wide array of potential values for T2108.
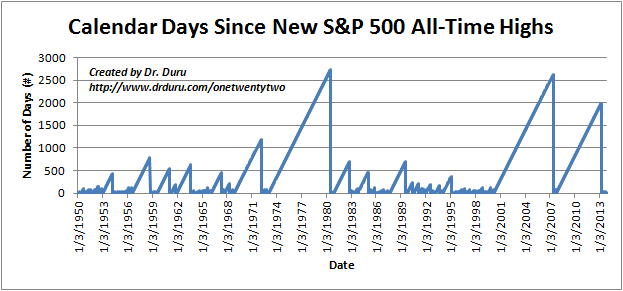
I have updated both charts from the March study and posted them below. As a quick refresher, the first chart simply shows the number of days since the last all-time high. This chart identifies the long stretches in recent market history where the S&P 500 did not make any new all-time highs. In the second chart, I plot T2108 versus the S&P 500 only for those days where the index made new all-time highs. The black circles show the value of T2108 on the given date (see right-hand axis). The blue line shows the value of the S&P 500 in log scale (see the left-hand axis). Notice the lack of relationship remains. Curiously, the general downtrend in the T2108 range seems to have ended. The current period’s range of T2108 values mimics the range from the end of the last bull market.
Click on the images for a larger view…
While history tells me not to be surprised that T2108 is “so low” as the S&P 500 surges to new all-time highs, I am still wrestling with the strange and persistence divergence between T2108 and the S&P 500. This divergence may have reached a climax today (November 13, 2013) as T2108 managed to SINK as low as 45.5% in the first 5 minutes of trading before the S&P 500 darted to new all-time highs. T2108 and the S&P 500 followed each other higher for the entire day. Yet, T2108 closed only at 52.2%, still well within a 3-week downtrend.
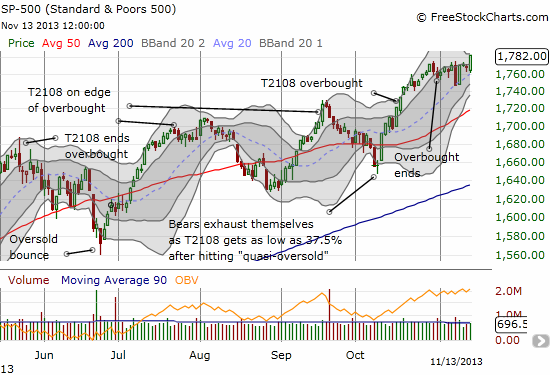
I have so far refrained from calling this divergence a bearish divergence because of past experience in misreading these events. For one brief day, it seemed that this divergence was indeed bearish. In retrospect it looks like that swoosh downward simply served to flush out the last crop of sellers and clear the way for buyers to soar once more. Now, the tempting interpretation is that the S&P 500 could launch into a major rally as those stocks that have weighed on T2108 will start to play catch-up. Certainly, seeing T2108 finally follow-through to the upside will all but confirm this more bullish interpretation.
In the meantime, I am holding onto the last round of SSO puts and SDS shares. As promised, I am giving them a little more room to breathe given the uncertainty on interpreting this divergence. A close above or around 1800 on the S&P 500 likely gets me out the SDS shares. Aggressive traders should consider dumping shorts and replacing with longs with a stop below the day’s low. I have not yet decided when to go with SSO calls, but it will not take much at this point!
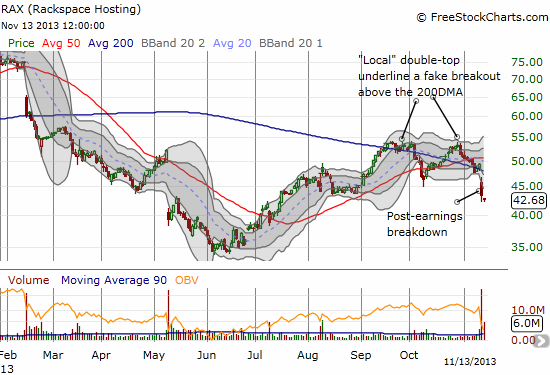
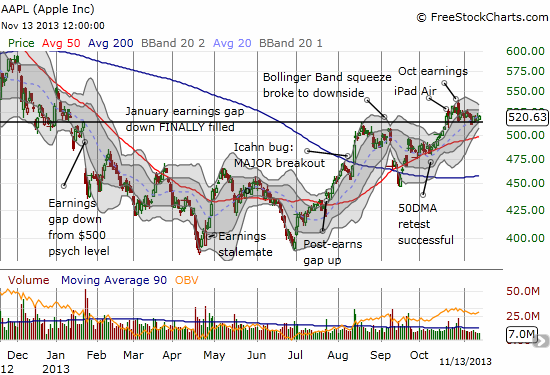
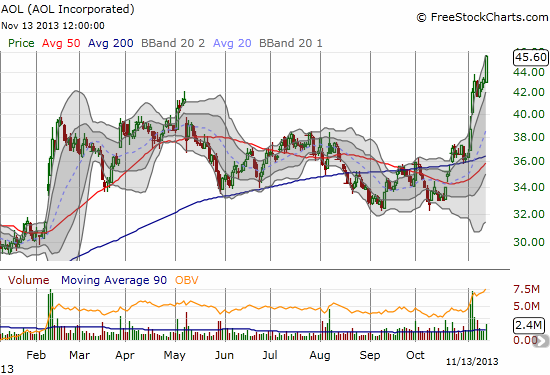
I end with two interesting charts which do NOT demonstrate slavish loyalty to the S&P 500′s new all-time highs and one that does. Rackspace Hosting (RAX) suffered a devastating post-earnings breakdown below its 50 and 200DMAs, making it look like a classic short. Apple (AAPL) is lazily bouncing along support at the closing of its January gap down. Keeping with this spirit of indecision, the Apple Trading Model (ATM) has been throwing a lot of weak signals that I find non-tradeable. The odds for an upside day for Thursday are 56%. AOL Incorporated (AOL) has incredibly soared 25% this month in a near parabolic move after November 5th earnings.
Daily T2108 vs the S&P 500
")
Red line: T2108 Overbought (70%); Blue line: T2108 Oversold (20%)
Weekly T2108

*All charts created using freestockcharts.com unless otherwise stated
The T2108 Resource Page
Expanded daily chart of T2108 versus the S&P 500
Expanded weekly chart of T2108
Be careful out there!
Full disclosure: long SSO puts, short SCTY put, short FSLR shares