
(T2108 measures the percentage of stocks trading above their respective 40-day moving averages [DMAs]. It helps to identify extremes in market sentiment that are likely to reverse. To learn more about it, see my T2108 Resource Page. You can follow real-time T2108 commentary on twitter using the #T2108 hashtag. T2108-related trades and other trades are posted on twitter using the #120trade hashtag)
T2108 Status: 62.2%
VIX Status: 14.1
General (Short-term) Trading Call: Hold
Active T2108 periods: Day #61 over 20% (overperiod), Day #86 under 70%
Reference Charts (click for view of last 6 months from Stockcharts.com):
S&P 500 or SPY
SDS (ProShares UltraShort S&P500)
U.S. Dollar Index (volatility index)
VIX (volatility index)
VXX (iPath S&P 500 VIX Short-Term Futures ETN)
EWG (iShares MSCI Germany Index Fund)
CAT (Caterpillar)
Commentary
When the Federal Reserve backed away from tapering last week, the S&P 500 (SPY) soared right to the edge of overbought conditions. The index has slowly but surely done its own retreat since then. On Monday (yesterday) the Fed fade completed. Now, it looks like the S&P 500 is headed for another retest of its 50DMA.
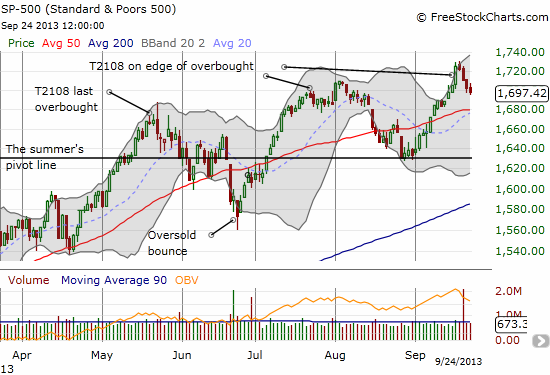
Interestingly, T2108 has stopped declining. It was essentially flat on Monday and increased marginally on Tuesday. I call this a bullish divergence as the short-term momentum seems to be swinging upward again.
Similarly, the U.S. dollar index has not lost any new ground since its post-Fed plunge (note the graph below has an error in the first post-Fed day).
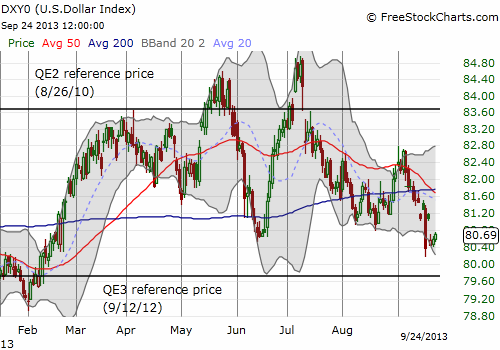
I am not sure yet what to make of ANY currency movements as forex has tended to careen wildly and widely from one catalyst to the next.
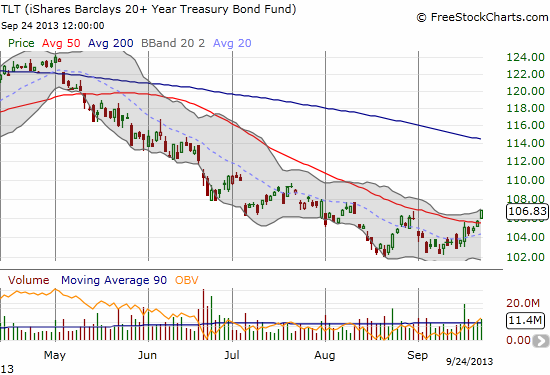
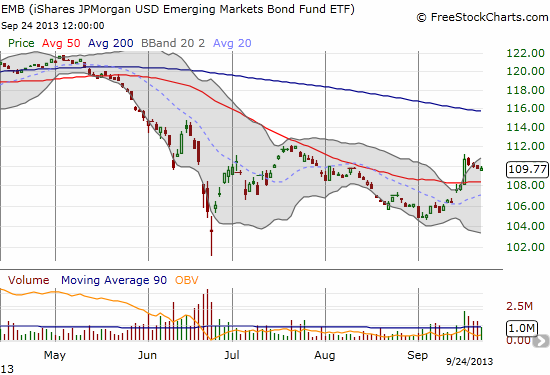
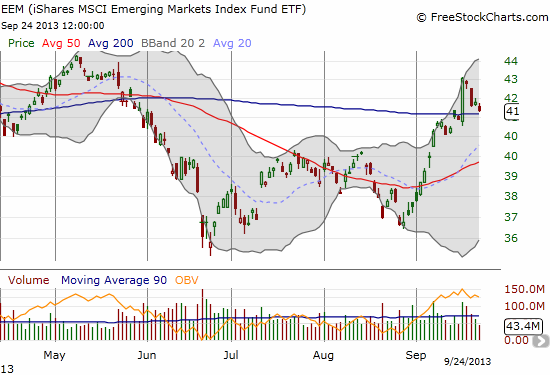
Finally, perhaps the most interesting development is a small, budding rally in U.S. government bonds, for example, the iShares Barclays 20+ Year Treasury Bond ETF (TLT). In parallel, despite expectations, lower bond yields are NOT helping emerging markets as BOTH the iShares MSCI Emerging Markets ETF (EEM) and the iShares JPMorgan USD Emerg Markets Bond ETF (EMB) continue their own post-Fed fades. I post the charts below for comparison.
Putting this altogether, I am guessing the market could meander for a while until a new catalyst. That catalyst of course could be something around the budget battles in the U.S. Federal government. Markets do not seem to think the government will shut down and/or that such a temporary move will impact markets, but some unexpected twist here could send the market freshly soaring or plunging. I am not one for trying to forecast or second-guess political machinations, so I am continuing to keep an eye on the technicals. Everyone of course remembers what happened in 2011, so I strongly suspect we will NOT get the same kind of sell-off that we had in 2011. Remember, given the market is much higher now, the lesson learned from that episode is that such dips are a buying opportunity. It will thus take a lot more to convince people to get fooled into selling in response to the same drama.
Daily T2108 vs the S&P 500
")
Black line: T2108 (measured on the right); Green line: S&P 500 (for comparative purposes)
Red line: T2108 Overbought (70%); Blue line: T2108 Oversold (20%)
Weekly T2108

*All charts created using freestockcharts.com unless otherwise stated
Related links:
The T2108 Resource Page
Expanded daily chart of T2108 versus the S&P 500
Expanded weekly chart of T2108
Be careful out there!
Full disclosure: long EEM strangle (out-of-money calls and puts), long TBT