
(T2108 measures the percentage of stocks trading above their respective 40-day moving averages [DMAs]. It helps to identify extremes in market sentiment that are highly likely to reverse. To learn more about it, see my T2108 Resource Page. You can follow real-time T2108 commentary on twitter using the #T2108 hashtag. T2108-related trades and other trades are posted on twitter using the #120trade hashtag)
T2108 Status: 52.8%
VIX Status: 13.0
General (Short-term) Trading Call: Aggressive traders should have stopped out of 1700 breakout trades on the S&P 500
Active T2108 periods: Day #30 over 20% (overperiod), 60% overperiod ended at 15 days, Day #2 under 60% (underperiod), Day #54 under 70%
Reference Charts (click for view of last 6 months from Stockcharts.com):
S&P 500 or SPY
SDS (ProShares UltraShort S&P500)
U.S. Dollar Index (volatility index)
VIX (volatility index)
VXX (iPath S&P 500 VIX Short-Term Futures ETN)
EWG (iShares MSCI Germany Index Fund)
CAT (Caterpillar)
Commentary
T2108 never made it to overbought territory as I expected it would by now. July 24th now looks like a decisive day that capped the run in T2108. However, this was NOT the top in the S&P 500. In fact, the S&P 500 is currently trading a hair above the close on that day. I believe this is a rare situation to have T2108 drop all the way from 68% to 53% while the S&P 500 manages to crack new highs (all-time highs in this case!) in between and trade flat overall. I have not been able to do the historical review, but I am assuming this represents a “quietly” waning momentum in the market – quiet in that some stocks are fading backward without notice because the index remains aloft.
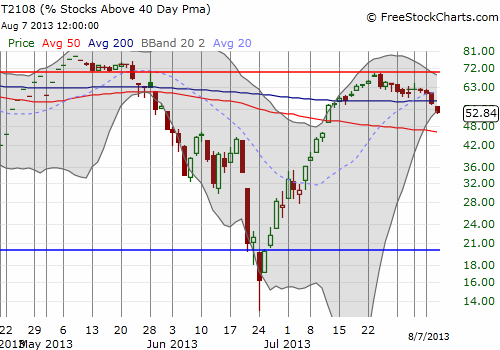
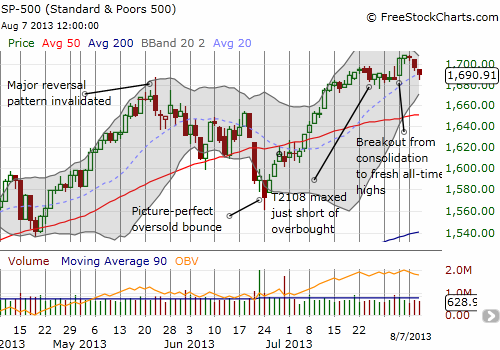
It is possible to have both a bearish and bullish interpretation of this action (such confusion matches the mixed signals in the market!). A bearish divergence could be in place with T2108 serving as the leading indicator. The bullish interpretation says that there remains room to run to the upside since T2108 has not crossed overbought yet. I prefer the bearish interpretation because the S&P 500 (SPY) appears to have lost its momentum. Moreover, T2108 looks ready to trade even lower just from a technical standpoint: failure at 70% “resistance”, cracking the 200DMA, and very little sign of life for two weeks straight. At the time of writing, Chinese export/import data has printed very strong, well above expectations. I strongly suspect this will provide lift to the market on the day. If so , it presents a good fading opportunity, at least unless the S&P 500 goes on to break out to new all-time highs.
So, it is not possible to say much more except that a trade of a breakdown or a breakout such provide a sustainable position. With the S&P 500 breaking below 1700, the odds seem in favor of cracking below the recent consolidation period, say below 1676. However, do not forget about the rapidly rising 50DMA which should provide initial support for any downdraft.
All this uncertainty means I have yet to place any T2108 trades in quite a long time. I hope the muscles are not atrophying.
In the meantime, the formalized Apple Trading Model (ATM) has been doing well. The first two days were, surprisingly enough, predictions of up days (Friday and Monday) that the ATM absolutely nailed it in a big way. I post the prognostications on twitter using the #120trade hashtag and referring to “ATM.”
The two days after that were mixed. The model voted 3 out of 4 for an up day Tuesday and evenly split for an up day on Wednesday which I declared a bias for downside. Because of the “discord,” I had no trade recommendations. This gives the model a 25% miss rate which is exactly the estimated error rate of the model. For Thursday, the model is 3 of 4 for an up day. The voting is an improvement to the ATM that allows me to assess comprehensively what the model predicts using different slices of historical data. I have a model using data from 2010 to now, 2011 to now, 2012 to now, and year-to-date. In future versions, I might decide to give more weight to the models using more recent data. (Note that I am currently positioned for a down ending to the week for AAPL with a modest 460/455 put spread.)
Daily T2108 vs the S&P 500
")
Black line: T2108 (measured on the right); Green line: S&P 500 (for comparative purposes)
Red line: T2108 Overbought (70%); Blue line: T2108 Oversold (20%)
Weekly T2108

*All charts created using freestockcharts.com unless otherwise stated
Related links:
The T2108 Resource Page
Expanded daily chart of T2108 versus the S&P 500
Expanded weekly chart of T2108
Be careful out there!
Full disclosure: long AAPL shares and put spread