
(T2108 measures the percentage of stocks trading above their respective 40-day moving averages [DMAs]. It helps to identify extremes in market sentiment that are highly likely to reverse. To learn more about it, see my T2108 Resource Page. You can follow real-time T2108 commentary on twitter using the #T2108 hashtag. T2108-related trades and other trades are posted on twitter using the #120trade hashtag)
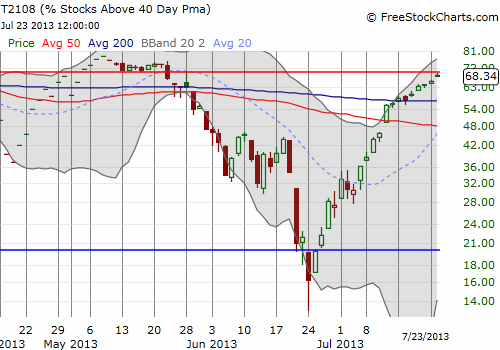
T2108 Status: 68.3%
VIX Status: 12.7
General (Short-term) Trading Call: Aggressive traders who got long the breakout should start locking in profits
Active T2108 periods: Day #19 over 20% (overperiod), Day #5 over 60%, Day #46 under 70%
Reference Charts (click for view of last 6 months from Stockcharts.com):
S&P 500 or SPY
SDS (ProShares UltraShort S&P500)
U.S. Dollar Index (volatility index)
VIX (volatility index)
VXX (iPath S&P 500 VIX Short-Term Futures ETN)
EWG (iShares MSCI Germany Index Fund)
CAT (Caterpillar)
Commentary
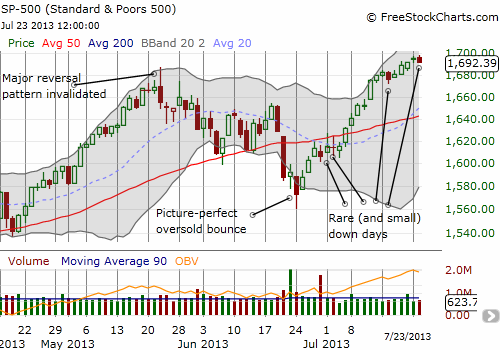
T2108 did not quite meet my forecast of tripping overbought today, but we might call this “close enough” at 68.3%. Certainly, aggressive traders who bought the S&P 500 breakout above the 50DMA should start locking in profits as part of some risk management for the trade(s). The S&P 500 has been on a near straight run since bouncing out of oversold conditions, and the opportunity for being aggressively bullish is running its course.
The daily/intraday view of T2108 demonstrates even better the sharpness of the recovery from oversold conditions. Note the strong V-shape.
For additional clues on what to expect for an imminent overbought period, I have been closely watching the volatility index (VIX), the iShares MSCI Emerging Markets Fund ETF (EEM), the U.S. dollar index (UUP), and interest rates (TLT for simplicity). The VIX managed to record an up day, but it is the changing relationships amongst EEM, the U.S. dollar index, and interest rates that are of most interest to me here.
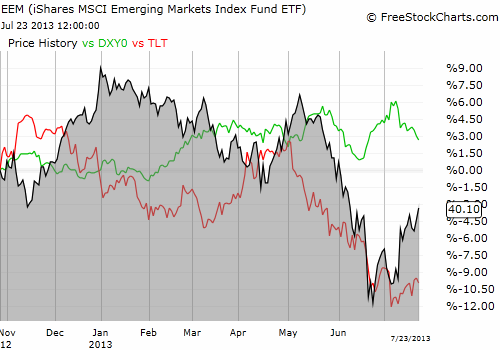
While interest rates were soaring from May and into June (TLT price decreasing), the 2013 sell-off in EEM accelerated and the dollar index first rallied and then pulled back. It appeared that higher rates were killing the emerging market trade by making the risk/reward even worse than it had been. However, NOW, interest rates have pulled back ever so slightly but EEM has soared. EEM is trading right at resistance at the 50DMA and directly above the June short consolidation area that served as the launching platform for a sharp 2-day plunge. This plunge carved out EEM’s current bottom. Either EEM has zipped far ahead of itself and/or interest rates will soon drop at a faster pace. Note well in the chart above that EEM and TLT have sometimes diverged for long stretches, like November to December of 2012 and March, 2013. In other words, it is very important not to over-extrapolate these relationships: the market is prone to quickly change its mind on what trends are salient at any given time.
The dollar index is the hardest to read as it basically continues to bounce in a rough range. I was correct in calling an end to the U.S. dollar rally after Federal Reserve Chairman Ben Bernanke helped clock the index after reassuring the market about monetary policy. The drop has accelerated in the last three days, so I strongly suspect the end of the correction is approaching (at which time I will have to yet again reassess my bullishness on the British pound versus the U.S. dollar).
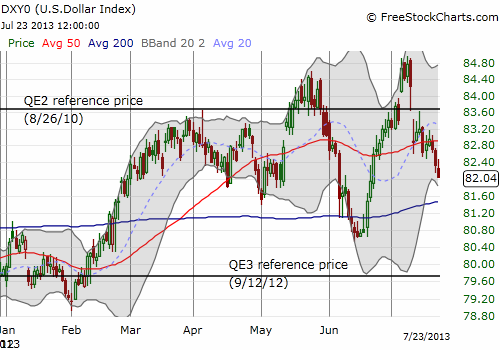
While the current drop in the U.S. dollar seems to be helping EEM, a steeper drop in the U.S. dollar did not help EEM one bit during the month the S&P 500 (SPY) was selling off.
In other words, the larger context is going to be important to understand the relationships that are working for the moment. It currently seems central banks are causing a lot of the extra volatility.
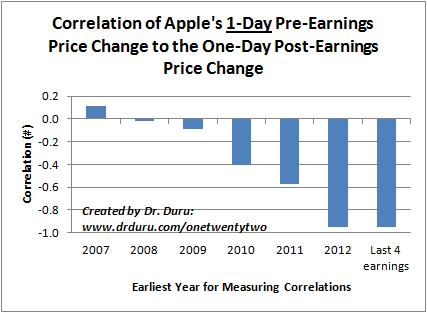
In other news, Apple (AAPL) reported earnings tonight. The stock dropped almost 2% going into the close ahead of earnings. It was the perfect buying opportunity to play what I expected to be a bullish post-earnings reaction. However, the drop into the close made it highly unlikely my $450 call expiring on Friday would yield much, if any, profit except uner the most extreme upward post-earnings surge. I was holding it after passing up a 30% or so gain at the immediate open on Monday where Apple put on its typical show of strength to begin the week. With hindsight I was being too bullish. So, as I tweeted ahead of my trade, I bought an August (monthly) $440/450 call spread as my refreshed pre-earnings trade. Over the past 6 earnings cycles or so, AAPL has tended to trade post-earnings in the opposite direction from the close going into earnings.
A call spread made sense this time as I saved almost 30% on the trade with an approximate upside target of $450 in the month after earnings. $450 is around the highs that stretched from May to June and is the next resistance point.

In after hours trading, AAPL got as high as $440, pulled back to the old $432 pivot (now support again), and drifted upward to $435. I suspect Apple could pull back as far as $430 or so in a short-term “worst case” scenario. Regardless, I think AAPL will enjoy a mostly bullish post-earnings period, at least for the first month or so.
Finally, the GOOG post-earnings trade ended with the close of my weekly 890/900 call spread. I posted the trade on twitter (with the #120trade hashtag). Given the setup, the trade worked about as well as I could have hoped. GOOG closed its post-earnings gap down in just two days. Today it returned most of yesterday’s gain, but held 20DMA support. I continue to like buying the dips on GOOG until it approaches $1000.
Daily T2108 vs the S&P 500
")
Black line: T2108 (measured on the right); Green line: S&P 500 (for comparative purposes)
Red line: T2108 Overbought (70%); Blue line: T2108 Oversold (20%)
Weekly T2108

*All charts created using freestockcharts.com unless otherwise stated
Related links:
The T2108 Resource Page
Expanded daily chart of T2108 versus the S&P 500
Expanded weekly chart of T2108
Be careful out there!
Full disclosure: long AAPL shares and calls; long EEM puts and put spread; long TBT