
(T2108 measures the percentage of stocks trading above their respective 40-day moving averages [DMAs]. It helps to identify extremes in market sentiment that are highly likely to reverse. To learn more about it, see my T2108 Resource Page. You can follow real-time T2108 commentary on twitter using the #T2108 hashtag. T2108-related trades and other trades are posted on twitter using the #120trade hashtag)
T2108 Status: 63.9%
VIX Status: 12.5
General (Short-term) Trading Call: Hold – Aggressive traders who got long the breakout can STILL stay long; otherwise, buy dips with tight stops
Active T2108 periods: Day #17 over 20% (overperiod), Day #3 over 60%, Day #44 under 70%
Reference Charts (click for view of last 6 months from Stockcharts.com):
S&P 500 or SPY
SDS (ProShares UltraShort S&P500)
U.S. Dollar Index (volatility index)
VIX (volatility index)
VXX (iPath S&P 500 VIX Short-Term Futures ETN)
EWG (iShares MSCI Germany Index Fund)
CAT (Caterpillar)
Commentary
The S&P 500 is tentatively creeping toward what is now starting to look like a major overbought period.
First, it has been 44 days since T2108 dropped below the 70% overbought threshold. The graph below shows that the S&P 500 is right at a critical juncture where the bias of performance declines from positive toward negative. The downside risks – the spread of historical performance – increase dramatically. At 2.2%, the S&P 500’s performance for the 70% underperiod is almost exactly where we would project it if the underperiod ended now. As a reminder, the blue dots represent historical data points, and the red dots represent projections (using Supply Vector Machines, radial configuration).
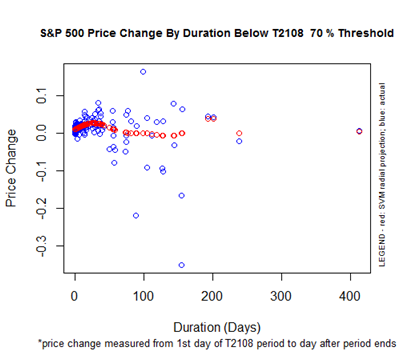
In other words, if T2108 does not reach overbought status this week, then it will get a lot more attractive to start shorting the market (I updated my forecast to overbought by Tuesday). At such a point I will also recommend closing out short-term long positions opened as a play on the S&P 500’s last breakout. This kind of additional insight is one of the benefits of my major overall of the T2108 Trading Model (TTM). If T2108 does cross into overbought territory, I will essentially “reset” the outlook. As always, I will take this one step at a time.
In the meantime, the S&P 500 has completely invalidated the major reversal pattern from May 22nd.
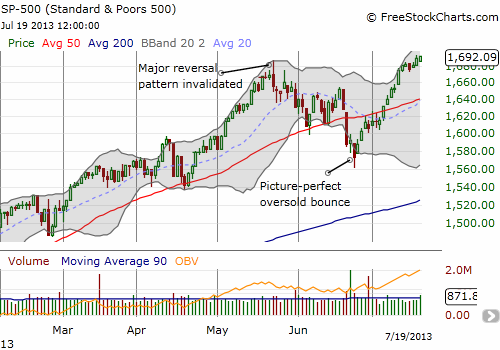
May 22nd was also the day T2108 dropped out of overbought status. The combination was a powerful red flag and motivated me to write “May 2013 Was Fine As Expected; Now Brace For Summer Volatility” as a summary or follow-up on a series of T2108 Updates warning of the topping pattern. However, the following key quote from that piece reminded readers that the summer’s dips are likely to represent buying opportunities:
“Measured from June 1st to August 31st, the S&P 500 returns an average of 0.90% and a median of 1.57%. This strong skew includes big extremes in performance: from a maximum performance of 13.9% to a minimum performance of -17.3%. When the summer sells-off, it tends to get very ugly. If it does not sell-off, the summer tends to perform very well. Given that May was an up month, the odds strongly favor an up summer by an almost 2:1 margin. Since 1950, when the S&P 500 closed May in positive territory, the summer finished in positive territory 23 times and finished in negative territory 12 times. I like to interpret the overall results for summer as meaning that it makes sense to buy the dips in the summer, especially the big ones.”
This outlook motivated my aggressively bullish approach to the acceleration of the sell-off into late June’s oversold conditions despite all the obvious technical and fundamental dangers abounding. Relatedly, even if I switch to a bearish bias, it will be opportunistic and constrained. Overall, the summer is looking pretty good.
The main fly in the ointment? Volatility. The VIX is sinking fast again. It plunged 9% on Friday. I am guessing part of the drop comes from a change in the calendar of options strikes that make up the VIX. Regardless, the historical data remind us that periods of low volatility tend to usher in periods of high volatility (almost a truism). In this case, it is manifest by brief and sometimes abrupt surges in the VIX which manifest as S&P 500 sell-offs.
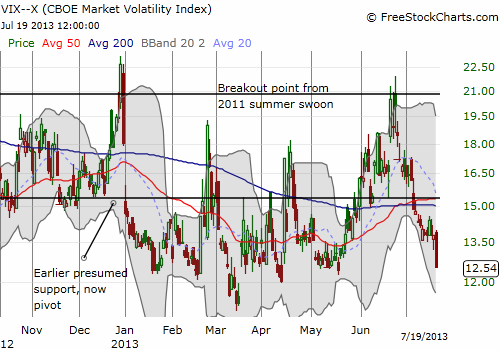
Given this chart, I am back to more actively monitoring the machinations of the VIX. I already dumped my latest round of VXX puts a week ago or so. I still hold a small core of VXX shares.
Now on to a review of recent select trades and missed opportunities.
SolarCity (SCTY)
As I feared, my SCTY call options went down in flames. It was simply too much to expect a complete turn-around in a few days after the Tesla (TSLA) downgrade that took down SCTY in sympathy. For those who bought shares, the setup remains very bullish and there is no reason to sell here.
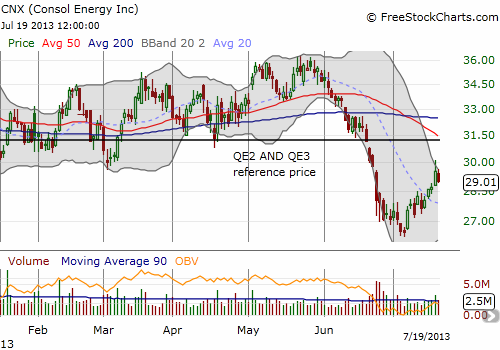
Consol Energy (CNX)
My CNX call options were part of what remained from my oversold trades. I pressed my luck here and lost. On Thursday, CNX surged nicely a point above my $29 strike price. I was not around to see it nor did I have a fortuitous limit order to sell at that point (it was set a little above!). By the time I was looking at the market for an update, CNX was smartly pulling back. Instead of dumping immediately, I crossed my fingers and hoped for a recovery the next day. I got exactly the opposite. You win some, you lose some. Note in the chart below, the uptrend from the lows remains well intact. For those long shares, there is every reason to keep holding as long as that uptrend remains intact.
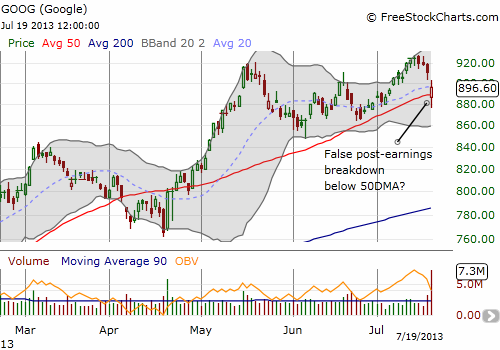
Google (GOOG)
My fortunes were dramatically different for the GOOG earnings play. As I indicated earlier, I am now confident enough in the Google trade to start posting my ideas real-time on my twitter feed. On Thursday, I changed my mind about leaving the GOOG pre-earnings trade alone and set a low ball order for a 925/935 call spread expiring the following Friday (July 26th). It never executed, and GOOG went on to fall as much as 5% or so in the after hours trading following earnings. As readers know from earlier posts, I have been salivating to get in on GOOG again on a dip – this mini sell-off looked like the perfect opportunity.
So, even with the stock cracking below 50DMA support, I gulped hard and executed on a 890/900 call spread expiring the following Friday – also tweeted on my twitter feed using the #120 hashtag. From there, GOOG shot up as much as 20 points or so. I missed the high point, but even after seeing the soft pullback I purposely decided to sit on the profits. GOOG is now above 50DMA support and showing resilience. Because I have a call spread, I just need GOOG to hold around current levels to increase my profit margin. I think targeting a close of $900 by the end of the week is quite reasonable with presumed minimal downside risks.
There was one lesson I learned (again) on this trade. I ended up paying around the same price for the call spread as I would have just buying the $900 call option. If I had just bought that option, I would have recorded a 150% gain at the close. The gain was 290% at the peak of the day. And yes, I would have locked in the profits under either case and called it a day. I applied this lesson to my Apple (AAPL) trade.
Apple (AAPL)
Apple (AAPL) investors have had a rough 10 months. The coming of another earnings call used to be eagerly anticipated as a moment to bask in the triumph of all things Apple. Now, earnings understandably brings trepidation and even loathing. In this context, I recognize to be an AAPL bull feels so old-fashioned. Yet, I find myself sticking by the longer-term bullish story…and I am marginally bullish for the upcoming earnings report from a technical standpoint.
First, the Apple bottom still looks like it has been successfully retested. While overall trading volume has steadily declined since April earnings, buying volume has outstripped selling volume since the apparent retest in the June selling. Friday’s 1.6% drop was certainly a setback, but no surprise given Apple’s history of poor Friday performances. Moreover, AAPL was trading right at double resistance from the 50DMA and old $532 pivot.
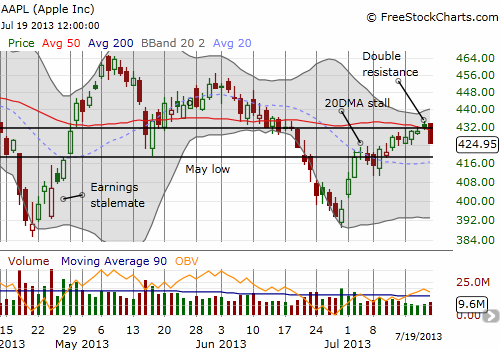
In inexplicable fashion, I neglected to make the near obvious trade of fading the early pop in AAPL on Friday. My only excuse is that I was watching GOOG so closely for a buying opportunity. However, I was all over the AAPL trade for buying in anticipation of a strong start to next week. Options are very expensive because of earnings coming on Tuesday, so I had originally resolved to buy a call spread. With the GOOG lesson weighing on my mind, instead of a 435/445 or 440/450 call spread, I went for an outright 450 call expiring the coming Friday (July 26th). If I get the pop I expect on Monday and/or Tuesday, I will just take the profit and watch earnings from the sideline. However, even a setback may actually get me doubling down. The chart below shows that for July earnings (since 2007), AAPL has the strongest tendency to trade post-earnings in the direction of the trade going into earnings (for more info on the Apple pre-earnings trade see for example “Bullish Earnings Trading Patterns And Sentiment Collide With Apple’s Recent Downtrend“).
Click graphic for a larger view…
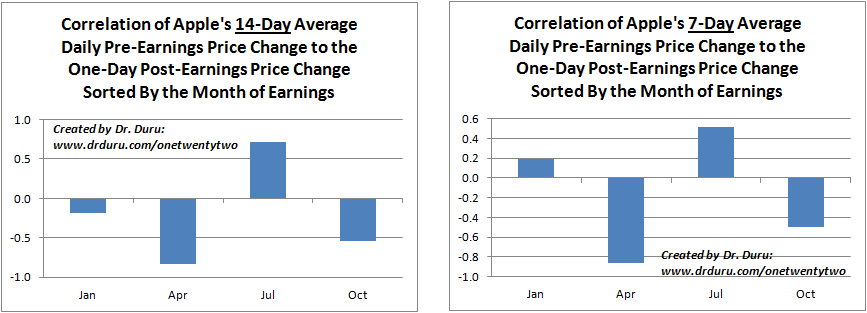
The 7 and 14-day averages are currently 0.15% and 0.50% respectively. This is not a ringing endorsement for the bullish post-earnings case, but it was enough to motivate me to proceed with the regular Apple weekly performance play even with the high prices. Stay tuned!
Daily T2108 vs the S&P 500
")
Black line: T2108 (measured on the right); Green line: S&P 500 (for comparative purposes)
Red line: T2108 Overbought (70%); Blue line: T2108 Oversold (20%)
Weekly T2108

*All charts created using freestockcharts.com unless otherwise stated
Related links:
The T2108 Resource Page
Expanded daily chart of T2108 versus the S&P 500
Expanded weekly chart of T2108
Be careful out there!
Full disclosure: long VXX; long AAPL shares and calls, long GOOG call spread