
(T2108 measures the percentage of stocks trading above their respective 40-day moving averages [DMAs]. It helps to identify extremes in market sentiment that are highly likely to reverse. To learn more about it, see my T2108 Resource Page. You can follow real-time T2108 commentary on twitter using the #T2108 hashtag. T2108-related trades and other trades are posted on twitter using the #120trade hashtag)
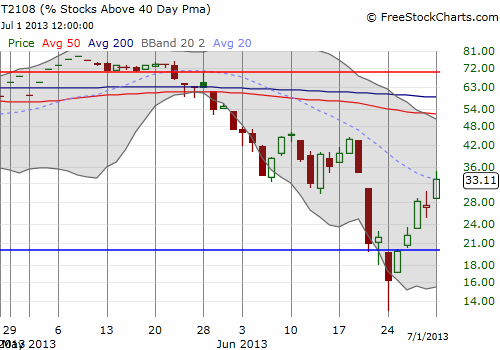
T2108 Status: 33.1%
VIX Status: 16.4
General (Short-term) Trading Call: Hold (aggressive traders can fade off resistance with tight stops, see below)
Active T2108 periods: Day #4 over 20% (overperiod), Day #9 under 40% (underperiod), Day #28 under 70%
Reference Charts (click for view of last 6 months from Stockcharts.com):
S&P 500 or SPY
SDS (ProShares UltraShort S&P500)
U.S. Dollar Index (volatility index)
VIX (volatility index)
VXX (iPath S&P 500 VIX Short-Term Futures ETN)
EWG (iShares MSCI Germany Index Fund)
CAT (Caterpillar)
Commentary
To regular readers, I again apologize for the disruption in service. You can find the missing archive of T2108 Updates split across two locations, Investing.com and my Seeking Alpha Instablog. The Investing.com articles cover archives that I lost in the server crash because my last back-up was almost a week old (lesson learned!). This was a critical trading period and hopefully you were at least able to follow my alerts on oversold trading conditions on twitter:
T2108 Update (June 19, 2013) – Early Breakout Suffers Prompt Reversal
T2180 Update (June 20, 2013) – “Essentially” Oversold But Danger Abounds
T2108 Update (June 21, 2013) – A Weak And Unconvincing Bounce
T2108 Update (June 24, 2013) – Oversold And Still Dangerous
T2108 Update (June 26, 2013) – Classic Oversold Bounce
T2108 Update (June 27, 2013) – Perfect Oversold Bounce Runs Into Perfect Resistance
This period covers some dramatic movements in T2108 that produced very rare oversold conditions.
While T2108 closed strong today, the S&P 500 did not. It faded again in near picture-perfect form from resistance which is now a combination of the 50DMA and the 1623 pivot (the old bear/bull dividing line). Yet another case of “you have to see it to believe it.”
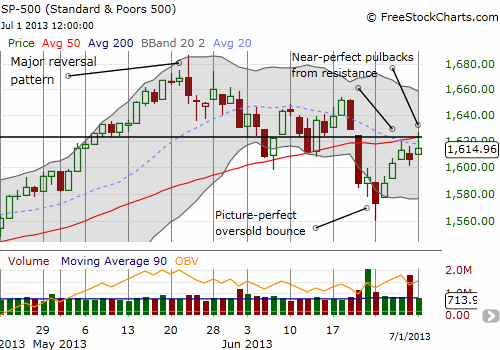
Very aggressive traders can short the S&P 500 here with a very tight stop above today’s high. I choose not to try such a trade because I remain impressed by T2108’s upward momentum. Moreover, I think today’s action produced a bullish divergence between T2108 and the S&P 500. The issue may not get resolved until post-holiday trading. Today’s rally was a classic first-of-the-month rally and produced reflexive buying, especially as part of a recovery from oversold conditions. With the holiday coming up, traders may be content to keep an eye on things but not to make any sudden moves. Expect a lot of churn and fake-outs.
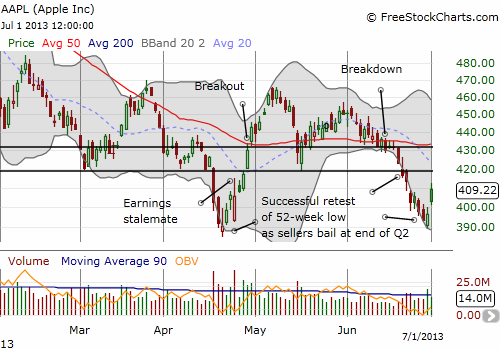
My tweets last week on Apple (AAPL) were particularly fortuitous. The Apple Trading Model (ATM) motivated me to bet on a weak end to the week and a strong beginning to this week. Once again, I moved early on both counts. I bought puts on Wednesday (on schedule) and sold puts into the selling on Thursday; I flipped calls the next day into the rally to $400. I decided not to play Monday’s likely rise, even when the stock pulled back a bit after today’s open. Just one of those moments I hesitated too much (and yet another reminder of why trading rules are so helpful – they free you of having to make ad hoc, on-the-fly, discretionary decisions in a hurried minute!). It was too bad too because Apple was up as much as 3.5% today. I think today confirmed that a lot of the selling that went into quarter-end came from fund managers and the like eager to get Apple off the books ahead of review time. However, I often wonder how true such characterizations can be. How will a manager explain sub-par or otherwise under-performance without being able to blame a few poor positions? Also, don’t the senior managers and/or investors in these funds know about these quarter-end games by now? Maybe they do not care…
Anyway, here is the latest Apple chart. Thankfully, it seems the 52-week low has been successfully retested. When I wrote about Apple sitting between a bottom and a hard $500, I did not really consider this retest part of a likely set of possibilities. It was only after AAPL broke through its 50DMA support in the following week did I suddenly realize the full extent of the downside risks.
The high volume buying of the last two days is part of a classic bottoming sign. I suppose this month’s earnings may be the real test and confirmation of this Apple bottom.
Daily T2108 vs the S&P 500
")
Black line: T2108 (measured on the right); Green line: S&P 500 (for comparative purposes)
Red line: T2108 Overbought (70%); Blue line: T2108 Oversold (20%)
Weekly T2108

*All charts created using freestockcharts.com unless otherwise stated
Related links:
The T2108 Resource Page
Expanded daily chart of T2108 versus the S&P 500
Expanded weekly chart of T2108
Be careful out there!
Full disclosure: long AAPL
Duru:
Sorry the hear about your disruption in service. This is a great and useful blog. I love reading it, even if it isn’t right 100% of the time!
Thanks for hanging in there!
And if I ever achieve oracle status with 100% predictions, I probably will spend a LOT less time writing…and more time vacationing… 🙂