
International Business Machines (IBM)
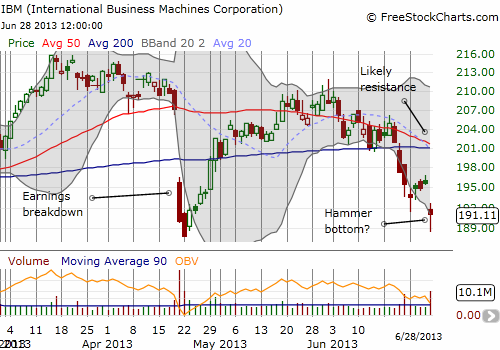
International Business Machines (IBM) experienced an unusually large post-earnings drop of 8.3% on April 19th. This was despite reaffirming its FY13 earnings guidance. After one more day of selling, it was off to the races. In less than a month, IBM had recovered all its post-earnings losses. The stock churned and made no progress from there, finally plunging through the month of June. This new sell-off culminated on the last day of the quarter in a high-volume, 2.3% drop reportedly in sympathy with poor earnings results from Accenture (ACN).
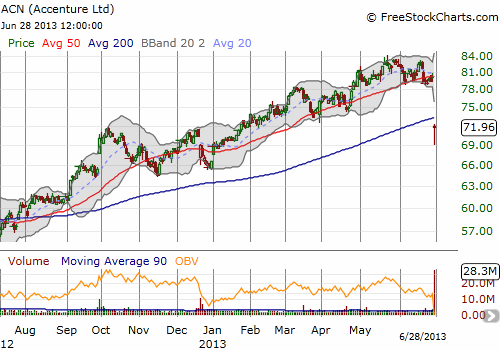
ACN disappointed the market by revising downward its earnings and revenue guidance for the year. The market promptly issued a 10.3% beating that was much worse at the lows. The breakdown ended a firm uptrend for ACN that was largely immune to the general market’s sell-off in June.
IBM’s stock also rebounded off its lows to form a hammer-like candlestick pattern, the second in a week. If the buying follows through this time, IBM should form a more lasting bottom. However, I am guessing the upside for IBM is strictly capped around the now declining 50DMA and the soon-to-decline 200DMA.
SolarCity (SCTY)
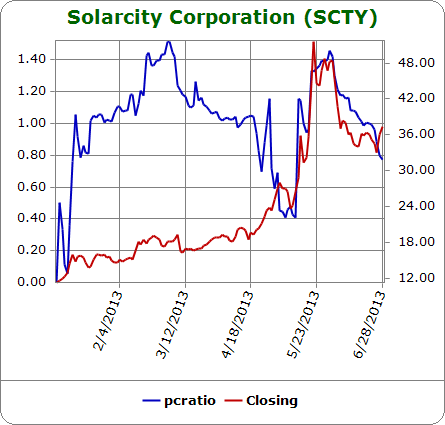
SolarCity (SCTY) has a fascinating chart. The stock is up significantly since its IPO last December. Buying volume only kicked into high gear ahead of earnings on May 13th. While the stock is trading back at those levels now after an IPO lock-up knocked the stock down a peg or two, it did go parabolic for a week after earnings. Now, the stock sits in the middle of a looming Bollinger Band (BB) squeeze. Indicated by the converging gray bands in the chart below, the BB squeeze is typically a sign of an imminent increase in volatility. The theory is to follow the stock wherever it darts out of this squeeze. However, false breakouts/breakdowns are a risk.
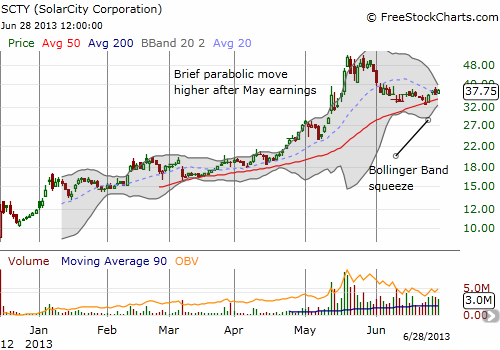
Source for charts: FreeStockCharts.com
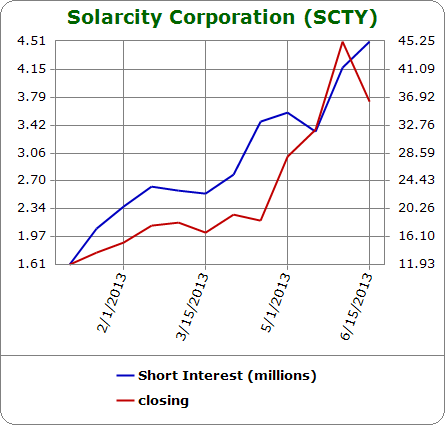
SCTY is also fascinating because so many traders are betting against it. This crowded trade increases the odds that the BB squeeze will be quite explosive. All the data below are from Schaeffer’s Investment Research for SCTY. They show a steady surge in short interest accompanied by a recent drop in implied volatility and the open interest put/call ratio. I am assuming implied volatility has declined thanks to shorts hedging by buying up calls. The drop in SCTY implied volatility to all-time lows is very consistent with the BB squeeze which represents a rapid reduction in volatility. The implied volatility chart suggests that the odds of jumping back up from here are very high.

Be careful out there!
Full disclosure: no positions