
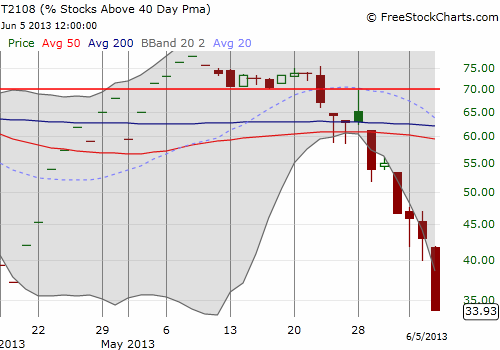
(T2108 measures the percentage of stocks trading above their respective 40-day moving averages [DMAs]. It helps to identify extremes in market sentiment that are highly likely to reverse. To learn more about it, see my T2108 Resource Page. You can follow real-time T2108 commentary on twitter using the #T2108 hashtag. T2108-related trades and other trades are posted on twitter using the #120trade hashtag)
T2108 Status: 33.9% (3rd straight day of quasi-oversold conditions)
VIX Status: 17.5
General (Short-term) Trading Call: If short, close out position. Otherwise, accumulate long position.
Active T2108 periods: 40% overperiod ended at 32 days; Day #1 under 40% (underperiod), Day #10 under 70% (underperiod)
Reference Charts (click for view of last 6 months from Stockcharts.com):
S&P 500 or SPY
SDS (ProShares UltraShort S&P500)
U.S. Dollar Index (volatility index)
VIX (volatility index)
VXX (iPath S&P 500 VIX Short-Term Futures ETN)
EWG (iShares MSCI Germany Index Fund)
CAT (Caterpillar)
Commentary
Yesterday’s missed opportunity turned into today’s missed bonanza. The S&P 500 broke clean through the bear/bull dividing line to lose 1.4%. The quasi-oversold scenario I described yesterday unfold almost exactly as I had envisioned it: a break of support, a plunge toward 50DMA support, and a close below the lower-Bollinger Band. These conditions alone put the index in an “over-stretched” position. T2108 is blaring quasi-oversold on its 4th consecutive day of losses (three quasi-oversold conditions in a row).

The last time something similar happened was in mid-February; this was the time I first explored the power and potential of quasi-oversold conditions. A sustained rally began the next day. HOWEVER, this trend is now VERY easy to see, especially the retests of the 50DMA and subsequent rallies. Odds are against this 4th time being a charm, but I followed the rules of quasi-oversold anyway. I started into a FIRST tranche of Pro Shares Ultra S&P 500 (SSO) calls. (As always, I tweeted the trade using the #120trade hashtag). The T2108 Trading Model (TTM) projects an 81% chance of a bounce tomorrow. Interestingly, the decision tree in the model branches only on the value of the VIX, the volatility index. Since 1990, there have been 31 occasions where the VIX has closed with a gain between 6.6 and 9.1%. In all but 6 of them, the S&P 500 closed up the following day. If the VIX had closed with a greater percentage gain, there is one scenario out of several where the TTM would have predicted another down day (again, remember that predictions of up days are much more reliable with the TTM).
(Note well that I am STILL holding my puts on Caterpillar (CAT). It has cleanly broken down from the 50DMA and filled its gap up from May 3rd. It is in clear danger of reversing ALL of its post-earnings recovery almost no matter what the S&P 500 does. I will tweet when I close out this trade).
If TTM nails another prediction, I strongly suspect it will happen only after a true test, and likely temporary violation, of the 50DMA support. I will then add a second tranche of SSO calls, and I will be quick to sell into any subsequent rally. Only a close above the current bear/bull dividing line will convince me that the bulls are starting to regain control.
Today also ended the 40% over-period at 32-days. Over this period, the S&P 500 gained 3.4%. This is at the extreme of the expected range of performance.
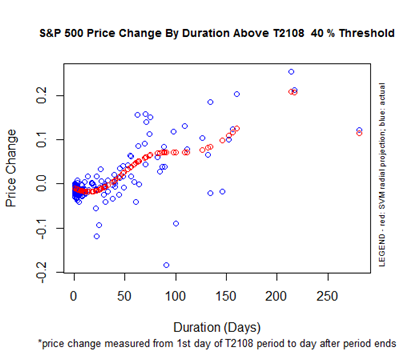
While this over-period turned out to be a historic outlier, the TTM still demonstrated the potential of betting on a reversion to expectations. Even the incorrect assumption of a drop to a 0% gain would have generated great gains shorting anytime in the past week. I am bookmarking this lesson for the next active over-period.
A new primary under-period has now begun. The 40% under-period is biased very slightly to the upside with a wide range of potential performances until about the 15th trading day. After that, the range of possibilities greatly widens, including some large negative performances. The bias turns negative after 30-days. So, there is a ways to go before an analysis of this under-period becomes interesting.
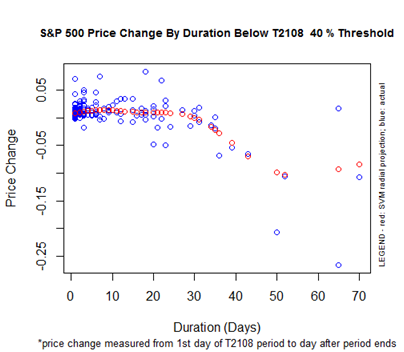
I am not tracking an over-period at this time.
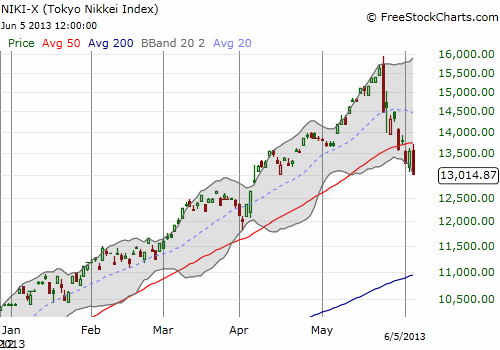
I conclude with this view of the Japanese Nikkei index. Note well how the index printed a major reversal pattern on May 23rd occurred the day after the S&P 500 printed its own. The apparent negative feedback loop between Japan’s major index and the U.S. major index seems well-intact right now and must certainly be damaging bullish psychology. The ability of the Bank of Japan to print its stock market up higher has been an inspiring display of the re/inflationary power of central banks and has surely provided a psychological boost here. But now, the current plunge has delivered a bright red warning flag with a 16.7% loss from the last closing high – almost a bear market!
Daily T2108 vs the S&P 500
")
Black line: T2108 (measured on the right); Green line: S&P 500 (for comparative purposes)
Red line: T2108 Overbought (70%); Blue line: T2108 Oversold (20%)
Weekly T2108

*All charts created using freestockcharts.com unless otherwise stated
Related links:
The T2108 Resource Page
Expanded daily chart of T2108 versus the S&P 500
Expanded weekly chart of T2108
Be careful out there!
Full disclosure: long SSO calls, long CAT puts and shares