
(T2108 measures the percentage of stocks trading above their respective 40-day moving averages [DMAs]. It helps to identify extremes in market sentiment that are highly likely to reverse. To learn more about it, see my T2108 Resource Page. You can follow real-time T2108 commentary on twitter using the #T2108 hashtag. T2108-related trades and other trades are posted on twitter using the #120trade hashtag)
T2108 Status: 42.9% (quasi-oversold)
VIX Status: 16.3 (flat from previous day and a second strong fade)
General (Short-term) Trading Call: Hold. Next short-term opportunity: breakdown below bear/bull dividing line and/or on retest of short-term downtrend line
Active T2108 periods: Day #32 of over 40% (overperiod), Day #3 under 50% (underperiod), Day #9 under 70% (underperiod)
Reference Charts (click for view of last 6 months from Stockcharts.com):
S&P 500 or SPY
SDS (ProShares UltraShort S&P500)
U.S. Dollar Index (volatility index)
VIX (volatility index)
VXX (iPath S&P 500 VIX Short-Term Futures ETN)
EWG (iShares MSCI Germany Index Fund)
CAT (Caterpillar)
Commentary
In the last T2108 Update I set out the conditions for initiating a fresh position in ProShares Ultra S&P 500 (SSO) puts as a retest of the growing downtrend from all-time highs on the S&P 500 and/or a breakdown below the bear/bull dividing line. Today, the S&P 500 (SPY) rose slightly early in the day, not quite reaching the downtrend line but hitting and then fading from the 20DMA. Given the T2108 Trading Model (TTM) predicted a down day for today, it occurred to me that I had a good enough case to launch into some SSO puts. By the time I moved to execute, the index was already back in negative territory. It was a missed opportunity!
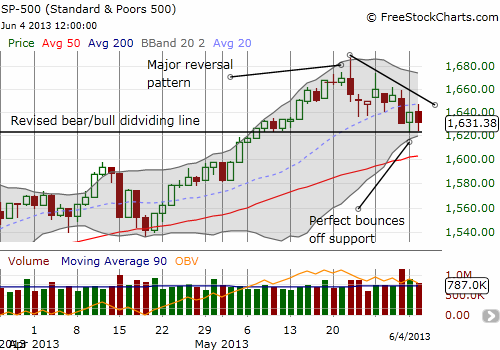
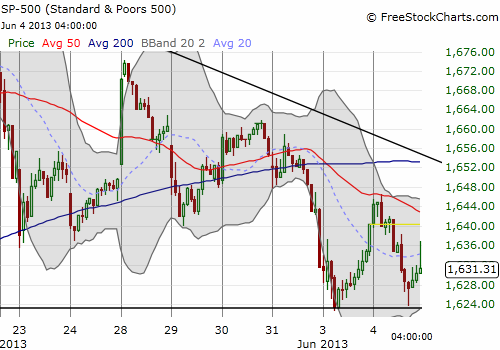
T2108 also plunged during the fade on the S&P 500. So, instead of browsing for puts, I ran the TTM to get a projection for quasi-oversold conditions (do I now need a model for three down days in a row?). I tweeted the results: a 56% chance of a rally tomorrow. These odds are not high enough to justify a trade (I prefer at least 70%). We may get yet another chance to play a quasi-oversold bounce as the bear/bull dividing line is looking more tenuous with the S&P 500 tentatively bouncing perfectly from this support for a 2nd day in a row. The perfect scenario will be a quick, deep plunge that takes the index to/toward the 50DMA. Such a retest will greatly reduce the downside risk of playing a bounce from quasi-oversold conditions. I will not even need to run the TTM under such conditions (and probably would not have time to do so!) given the S&P 500 will be trading well below the lower-Bollinger Band at that point.
One curious oddity for trading today. For 2013, Tuesday has had a strong upside bias with an average performance of +0.50%. When Tuesday closes down, Wednesday has an upward bias with a 0.25% return. HOWEVER, never this year has Tuesday closed -0.50% or lower. So, all bets are off – this is uncharted territory on a daily basis for this year. (For details and stats see my post “Daily S&P 500 Trading: Monday Under-Performance, Tuesday Out-Performance And Other Patterns“).
Daily T2108 vs the S&P 500
")
Black line: T2108 (measured on the right); Green line: S&P 500 (for comparative purposes)
Red line: T2108 Overbought (70%); Blue line: T2108 Oversold (20%)
Weekly T2108

*All charts created using freestockcharts.com unless otherwise stated
Related links:
The T2108 Resource Page
Expanded daily chart of T2108 versus the S&P 500
Expanded weekly chart of T2108
Be careful out there!
Full disclosure: no positions