(T2108 measures the percentage of stocks trading above their respective 40-day moving averages [DMAs]. It helps to identify extremes in market sentiment that are highly likely to reverse. To learn more about it, see my T2108 Resource Page. You can follow real-time T2108 commentary on twitter using the #T2108 hashtag. T2108-related trades and other trades are posted on twitter using the #120trade hashtag)
T2108 Status: 52.5%
VIX Status: 13.2
General (Short-term) Trading Call: Sell SSO calls and then hold.
Reference Charts (click for view of last 6 months from Stockcharts.com):
S&P 500 or SPY
SDS (ProShares UltraShort S&P500)
U.S. Dollar Index (volatility index)
VIX (volatility index)
VXX (iPath S&P 500 VIX Short-Term Futures ETN)
EWG (iShares MSCI Germany Index Fund)
CAT (Caterpillar)
Commentary
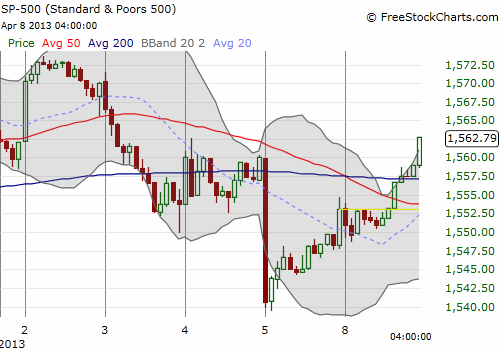
The S&P 500 (SPY) had a weak opening but ended very strong. The index maintained the upward bias that I discussed last Friday. Notice how the intraday trading is following a nice upward trend launching with pinpoint accuracy after the first 30 minutes of selling last Friday.

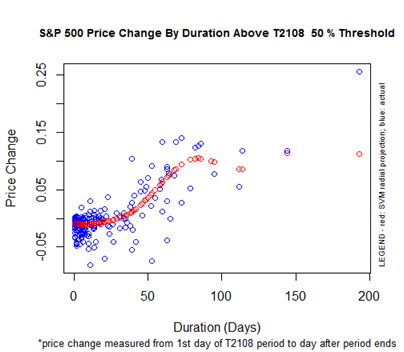
With this complete recovery of Friday’s post-employment report losses, T2108 jumped to 52.5%. This means that the T2108 “under period” is over for the 50% threshold. T2108 spent three days under 50% with the S&P 500 gaining just 0.6% at the close of the under period. Yet, given the timing of my SSO purchase, the call options are now up a nice 79%. This is up from the 30% gain at the close of Friday. At today’s lows, these call options returned to flat (meaning the trade could have started today with even bigger effect at the close). Now that T2108 is OVER 50%, the immediate bias switches to the downside. Yet, this conflicts with the uptrend and the close above the 20DMA for the S&P 500. The bias down does not turn distinctively positive until around day #40 (again, the red dots show the predicted performance of the S&P 500 based on the number of days that T2108 remains above the 50% threshold).

So, this is where I still need to use judgement in conjunction with the new T2108 Model. If I did not already have the SSO calls in-hand, I might be tempted to immediately short and/or buy SSO puts. But, overall, the prediction is marginal, essentially flat. So I have insufficient information for changing my bias and the risk/reward of the trade is not all that good. Instead, I will sell my SSO calls on Tuesday and sit tight…waiting for the next definitive signal. This model will be a benefit if it allows me to wait out more churn until the next clearer buying/selling opportunity.
Another potential insight is that the best trades are those where I am fading the S&P 500 once IT moves to the extreme against the T2108 model prediction. While there is likely nothing inherently special about thresholds that are a factor of 5 or 10, it is a quantifiable framework. This framework tells me that in the beginning, I should expect the S&P 500 to perform within a tight range, with a slight negative bias. Move too high too soon, and I may be inclined to fade UNLESS of course T2108 crosses yet another threshold and starts another counter. I have not yet thought through how the crossing of multiple thresholds should be managed. For example, I suspect the highest threshold should dominate the analysis, but this need not be the case.
Stay tuned! (And as always, if there is something that makes no sense, is too confusing, etc… do not hesitate to ask. The more questions I get, the faster we can mature this overhaul of the T2108 Model!)
Daily T2108 vs the S&P 500

Black line: T2108 (measured on the right); Green line: S&P 500 (for comparative purposes)
Red line: T2108 Overbought (70%); Blue line: T2108 Oversold (20%)
Weekly T2108

*All charts created using freestockcharts.com unless otherwise stated
Related links:
The T2108 Resource Page
Expanded daily chart of T2108 versus the S&P 500
Expanded weekly chart of T2108
Be careful out there!
Full disclosure: long VXX shares and puts; long SSO calls
