(T2108 measures the percentage of stocks trading above their respective 40-day moving averages [DMAs]. It helps to identify extremes in market sentiment that are highly likely to reverse. To learn more about it, see my T2108 Resource Page. You can follow real-time T2108 commentary on twitter using the #T2108 hashtag. T2108-related trades and other trades are posted on twitter using the #120trade hashtag)
T2108 Status: 85.3% (14th overbought day)
VIX Status: 12.4
General (Short-term) Trading Call: Initiate small short position if holding none already, sell some longs.
Reference Charts (click for view of last 6 months from Stockcharts.com):
S&P 500 or SPY
SDS (ProShares UltraShort S&P500)
U.S. Dollar Index (volatility index)
VIX (volatility index)
VXX (iPath S&P 500 VIX Short-Term Futures ETN)
EWG (iShares MSCI Germany Index Fund)
CAT (Caterpillar)
Commentary
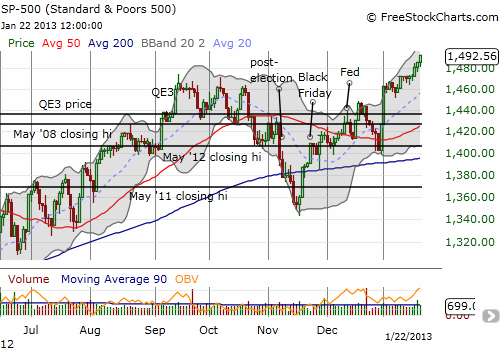
On Friday, January 18th, the VIX plunged to 12.46, hitting a 5 year and 8 month low, last seen May, 2008. The concurrent close on the S&P 500 was not nearly as dramatic: ending the day at the previous day’s intraday high although setting a new 5 year and 1 month closing high. Trading volume was high, likely due to January options expiration. T2108 closed at its 13th consecutive (extremely) overbought day. The market looked set to melt up and today began the process. The S&P 500 gained 0.44% to set a fresh 5+ year high.

I am going to call today the official beginning of the stock market’s melt-up. The steady move higher is likely going to make under-invested portfolio managers more and more uncomfortable. Without any intervening bad news, the current momentum should continue as they scramble to apply funds. No matter that the market is extremely overbought. In just five or so more trading days, these overbought conditions turn bullish, kicking off a buy the dip and sell quick strategy similar to last March. I will cross that bridge when/if we get there. In the meantime, it still makes sense to have a SMALL short position on (preferably puts!) and to judiciously unload longs to lock in profits.
Earnings season is now in full swing and should dominate the headlines into early February. That will then be just in time for anxieties to start to build over the coming March to May fiscal deadlines over the funding of the government and the Fiscal Cliff. Volatility may continue to drip lower through it all until some fresh headline interrupts the party. At this point, I cannot even hazard a guess as to what new thing could possibly unsettle the market. Fortunately, early Friday, I re-entered trades on VXX puts.
Finally, note that I have now added new lines on the T2108 charts to make it clear where the overbought and oversold areas are. What should stand out to you is how much more time the stock market spends overbought than oversold!
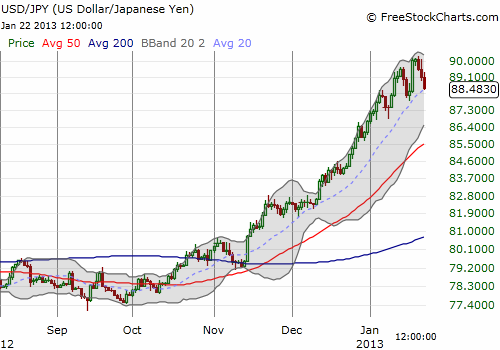
I am also beginning to wonder whether the sheer number of overbought periods symbolizes this monetary era of printing more and more money to solve economic problems – aka, don’t fight your local Central Bank. On Monday, the Bank of Japan made unlimited monetary easing official. While the subsequent counter-trend, “buy the news” surge in the yen seems to have halted the yen’s weakness for now, I am not letting that move paper over the fact that the Japanese may now join the Fed in distorting asset prices worldwide as paper money scrambles across the planet looking for the highest returns. I will talk more about this in another post. If you want to read some good, related ideas on this now, check out “The real worry is inflation” by my favorite gold bull Bill Fleckenstein.

Daily T2108 vs the S&P 500

Black line: T2108 (measured on the right); Green line: S&P 500 (for comparative purposes)
Red line: T2108 Overbought (70%); Blue line: T2108 Oversold (20%)
Weekly T2108

*All charts created using freestockcharts.com unless otherwise stated
Related links:
The T2108 Resource Page
Expanded daily chart of T2108 versus the S&P 500
Expanded weekly chart of T2108
Be careful out there!
Full disclosure: long VXX shares and puts, long USD/JPY, long GLD
