(T2108 measures the percentage of stocks trading above their respective 40-day moving averages [DMAs]. It helps to identify extremes in market sentiment that are highly likely to reverse. To learn more about it, see my T2108 Resource Page. You can follow real-time T2108 commentary on twitter using the #T2108 hashtag. T2108-related trades and other trades are posted on twitter using the #120trade hashtag)
T2108 Status: 60.6%
VIX Status: 16.1
General (Short-term) Trading Call: Hold (assuming at least some profits from oversold trade already locked. Otherwise, sell some)
Reference Charts (click for view of last 6 months from Stockcharts.com):
S&P 500 or SPY
SDS (ProShares UltraShort S&P500)
U.S. Dollar Index (volatility index)
VIX (volatility index)
VXX (iPath S&P 500 VIX Short-Term Futures ETN)
EWG (iShares MSCI Germany Index Fund)
CAT (Caterpillar)
Commentary
The media headlines continue to suggest that the drama of the Fiscal Cliff is making large swings from one pronouncement to another but the stock market has now settled down into a definite comfortzone. The S&P 500 managed to close marginally above its 50DMA although it has yet to recover all its post-election losses.

T2108 is also steadily creeping higher. On Monday, it closed within striking distance of overbought territory. This is truly remarkable against what is supposed to be a high-risk backdrop. My earlier assumption that the market would fall in and out of oversold status has not panned out. If the market does achieve overbought status before the Fiscal Cliff gets resolved, I will feel compelled to follow-through with the T2108 overbought rules to try an initial short. I have to assume at that point the market will be particularly vulnerable to any bad news. Of course, if you are already pre-disposed to being bearish on the prospects for a good resolution to the Fiscal Cliff, this is a perfect time to start planning, and even implementing, some short positions.
I conclude with three chart reviews: Apple (AAPL), Jinko Solar (JKS), and Freeport-McMoRan Copper & Gold Inc. (FCX).
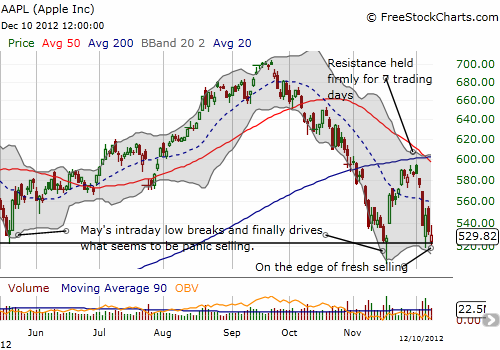
Despite a tame open in the general market, AAPL opened the week with a rapid plunge that stopped almost as soon as it started. The stock bounced back and even printed positive gains for a short time. The bad news is that AAPL retested critical support at the former intraday low from May. This is now the third test of that support and is a rapid retest from last week. These rapid retests rarely end well because enough time has not yet passed to build a stabilizing base of buyers. Instead, breaks of support will likely generate an amplified wave of selling as traders quickly get stopped out of positions and/or chase the stock downward. The chart below shows Apple is right at the edge of a fresh sell-off. My current assumption is that Apple will indeed soon sell-off a lot more given the continued heavy-volume (and such selling will likely {eventually} pull the rest of the market down with it).

I have decided to trade the uncertain outlook on AAPL shares by opening several call and put spreads covering multiple expirations. I hope to write more details on this structure in a future post.
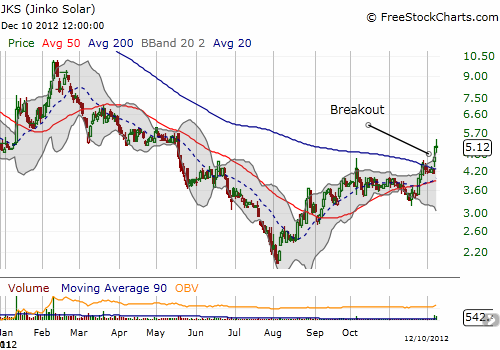
Jinko Solar (JKS) surged on heavy buying volume on Friday, December 7th. Buyers returned to the fray in high volume again today. While the stock is now up 2.5x from its recent all-time lows, Friday’s move marked the stock’s first true breakout. JKS last traded above its 200DMA in the summer of 2011, but this breakout is quite bullish for finally establishing a bottom. Here is the catalyst that propelled JKS to this breakout – I think it is time for me to write about the company again!
JKS “…announced that JinkoSolar (Switzerland) AG, its Swiss subsidiary, has entered into a strategic cooperation agreement (‘Strategic Cooperation Agreement’) with the Guangdong Branch of China Development Bank (‘CDB’), pursuant to which CDB intends to provide financing cooperation to JinkoSolar (Switzerland) AG of an aggregate amount up to US$ 1 billion over a five-year period. The final conditions, terms and amount of the financing under the Strategic Cooperation Agreement is subject to the parties’ further approval and will be set out in separate agreements.
JinkoSolar (Switzerland) AG will act as the platform to further expand the Company’s presence overseas as the Company intends to use the financing to develop its overseas expansion, merger, acquisition, and downstream business, including project development and EPC for Photovoltaic (‘PV’) solar power plants. Pursuant to the Strategic Cooperation Agreement, the two parties will establish a high-level joint meeting mechanism to evaluate the progress of major development projects.”

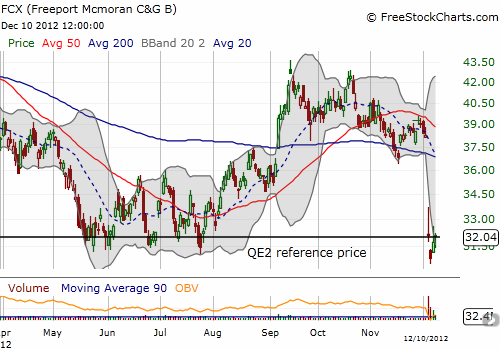
Finally, a quick update on FCX. The stock continues to loiter around its QE2 price. As I have pointed out on other occasions, this line has become a very important pivot point for the stock. I still think it is a buy here, and I wish I had sold puts during the first two days of selling.

Daily T2108 vs the S&P 500

Black line: T2108 (measured on the right); Green line: S&P 500 (for comparative purposes)
Weekly T2108

*All charts created using freestockcharts.com unless otherwise stated
Related links:
The T2108 Resource Page
Expanded daily chart of T2108 versus the S&P 500
Expanded weekly chart of T2108
Be careful out there!
Full disclosure: long FCX; long AAPL shares, call and put spreads; long JKS
