(T2108 measures the percentage of stocks trading above their respective 40-day moving averages [DMAs]. It helps to identify extremes in market sentiment that are highly likely to reverse. To learn more about it, see my T2108 Resource Page. You can follow real-time T2108 commentary on twitter using the #T2108 hashtag. T2108-related trades and other trades are posted on twitter using the #120trade hashtag)
T2108 Status: 56.9%
VIX Status: 16.5
General (Short-term) Trading Call: Hold (assuming at least some profits from oversold trade already locked. Otherwise, sells some)
Reference Charts (click for view of last 6 months from Stockcharts.com):
S&P 500 or SPY
SDS (ProShares UltraShort S&P500)
U.S. Dollar Index (volatility index)
VIX (volatility index)
VXX (iPath S&P 500 VIX Short-Term Futures ETN)
EWG (iShares MSCI Germany Index Fund)
CAT (Caterpillar)
Commentary
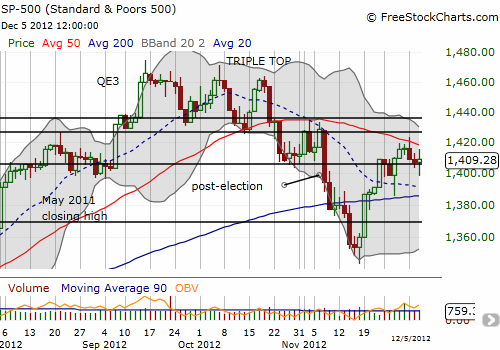
So much for volatility’s unusual 3-day rally. After the S&P 500 sank at Wednesday’s open, it seemed that the rally in volatility going into that day had some (bearish) meaning. Instead, the S&P 500 staged one of its classic sharp bounces off its lows of the day. But before bulls could get excited, the index sank into a weak close, ending the day near flat. A whole lot of huffing and puffing for nothing. It was a day of indecision as the S&P 500 fell back from 50DMA resistance once again.

T2108 drifted upward and is back to its highs for the current rally off oversold conditions. At current levels, it is still not providing directional clues.
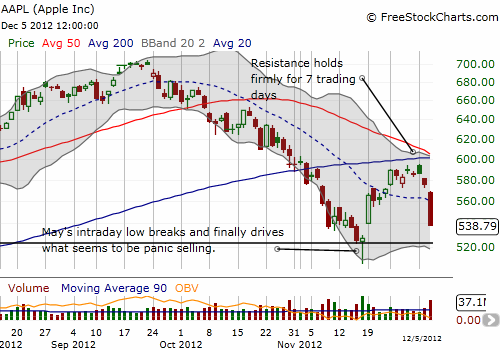
Part of the indecision of the index was likely created by the collapse in Apple (AAPL). AAPL had its worst performance in four years as it plunged 6.4%. While volume was very high, it did not exceed volume from the dramatic bottom on Nov 16th, it barely surpassed volume from July’s earnings gap down, and it matched volume from AAPL’s first retest of its 200DMA on October 26th. In a recent chart review I warned that AAPL had hit important resistance. I bought a put spread in anticipation of resistance holding. That put spread soared in value on Wednesday, and it was interesting to watch it increase even as AAPL struggled to stabilize. That increase was from an increase in implied volatility, and it told me to expect even lower prices on the underlying stock.
After AAPL swooned passed a 3% loss on the day, I figured it was time to cash in the chips. Aghast that the stock managed to print a 5% loss, I gathered my wits and decided to start buying call options. I doubled up on weeklies expiring Friday and finished the day with a January 585/600 call spread at the close – I picked $600 as the short end because it coincides with resistance. In other words, with a high likelihood that AAPL will get pinned at $600 on any subsequent rallies, the call spread will tend to achieve its maximum value toward or at expiration.
A close-up of AAPL’s chart shows how neatly resistance held…and how dangerous the stock looks now that it has wiped away most of its rally from the November lows.

What makes Apple so dangerous now is that Wednesday’s selling demonstrates that the weak hands, the panic sellers, and/or the profit-takers are not yet finished. The November lows are in immediate danger of breaking. The presumed explanation for the selling was an increase in margin requirements by a single stock broker. If that is indeed the case, then Apple should rally sharply within a week as the overhang dissipates. I will be unloading my call options into such a rally (but keeping my shares). A Seeking Alpha author theorizes that the increase in margin requirements could not possibly completely explain the sell-off – see “Apple’s Margin Hike Sell-Off: Should You Care?”
As you can imagine, I will be watching AAPL even more closely than usual!
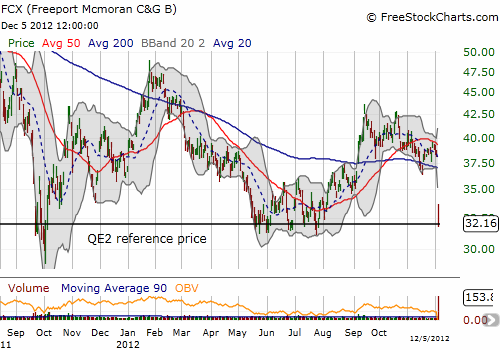
I conclude with one more chart review that will eventually require its own post. Freeport-McMoRan Copper & Gold Inc. (FCX) lost 16% on the day after announcing a major acquisition. The stock closed perfectly on top of its QE2 price. Given how well this line of support has worked, I was compelled to nibble on shares again. See “Using The QE2 Reference Price To Buy Freeport-McMoRan” for more details on how this trade works.

Daily T2108 vs the S&P 500

Black line: T2108 (measured on the right); Green line: S&P 500 (for comparative purposes)
Weekly T2108

*All charts created using freestockcharts.com unless otherwise stated
Related links:
The T2108 Resource Page
Expanded daily chart of T2108 versus the S&P 500
Expanded weekly chart of T2108
Be careful out there!
Full disclosure: long VXX shares and puts; long AAPL shares, calls, call spread, and put spread (leftover from earlier trade that now suddenly has value); long FCX
