While the general market churns, individual stocks continue to tell unique stories with good trading opportunities. In this chart review, I look at recent developments in Apple (AAPL), Google (GOOG), Priceline.com (PCLN), Siemens (SI), and Facebook (FB).
Apple (AAPL)
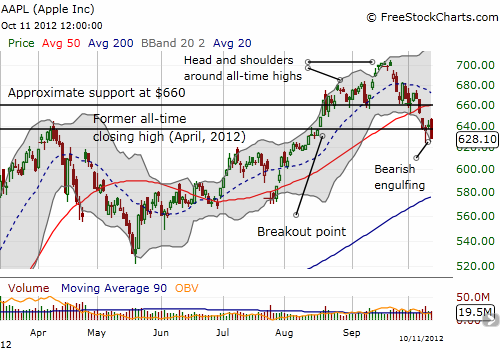
AAPL’s technicals continue worsening. On Thursday, October 11, AAPL printed a bearish engulfing pattern that essentially confirms the bearish signals descending upon the stock. I noted some of the bearish signs on October 8th when AAPL officially broke down:
- Head and shoulder pattern
- 20-day moving average (DMA) curving downward
- Breakdown below 50DMA
- Two major price support levels broken: $660 support and former all-time closing high from April
Looking below, I see no firm support until the 200DMA around $580. If Apple’s slide continues, I expect it to pause at the psychological $600 level for a bit. The flip side of this negativity is that it sets up for a positive post-earnings move (see “The Odds Deliver As Post-Earnings Apple Breaks April’s Downtrend” for more details).
While I wait for earnings, I have played AAPL calls but much closer to the vest. The best success has now come from intraday moves. I still cannot move myself to buy puts to play this breakdown.
Google (GOOG)
Google has been on a tear since the summer’s lows. Those lows correspond to GOOG’s price right before a big gap up after October earnings. Since then, GOOG has tacked on an incredible 200 points for about a 36% gain. The rally has been so strong that GOOG has followed its 20DMA straight up. Even Tuesday’s sharp sell-off stopped cold at the 20DMA. With such a strong rally going into earnings next week, the post-earnings reaction seems certain to be large. I bought a strangle (out-of-the-money calls and puts) anticipating that the stock may move strongly in anticipation of that big move. At a minimum, I am looking for a sharp increase in implied volatility next week that will make the overall position profitable as earnings approach.
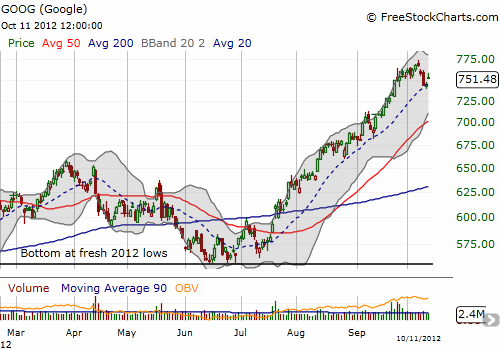
Google’s continued strength stands in stark contrast to Apple’s growing weakness. Ironically, this divergence began in earnest soon after Apple won its verdict against Samsung in the U.S.
Priceline.com (PCLN)
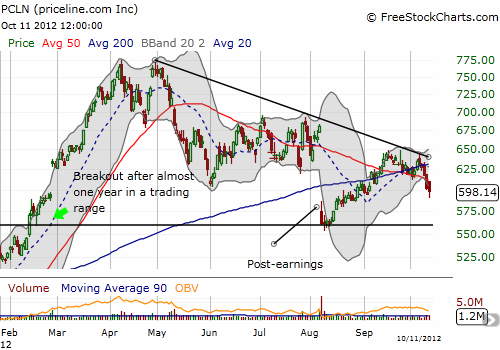
Priceline.com was looking promising after it defied my expectations for ending its post-earnings relief rally around $600 at resistance from the 200DMA. It broke out as high as $640 (a 14% bounce from post-earnings lows), but is now breaking down again below the 200 AND 50DMAs. This breakdown confirms the downtrend that remains in place since PCLN hit all-time highs in April. A fresh break below post-earnings lows would confirm an increasingly bearish outlook for the stock. (I have covered PCLN’s trails, technicals and earnings, in several posts, see archives).
Siemens Atkins (SI)
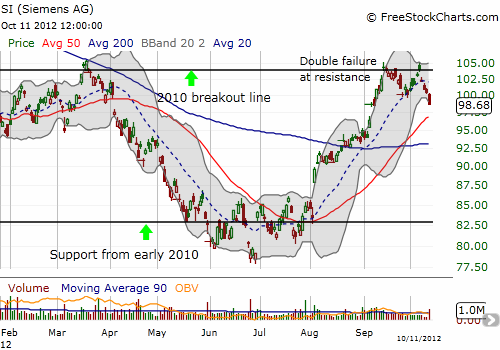
Siemens seems to have topped out at major resistance. In 2010, SI broke out around $104. That line has now served as approximate resistance since August, 2011. With the 20DMA finally broken, SI’s primary uptrend from the summer lows has ended. Both the 50 and 200DMAs are now in play.
Facebook (FB)
I have finally turned net bearish on Facebook. I was reluctant, but this is the trade that works. The first lock-up expiration has provided a pivot point for trading for about two months now. Even the gap up from Zuckerberg’s appearance at Tech Crunch September 12th took the stock just barely over the hurdle. The rally ended in dramatic fashion with a false breakout above the 50DMA. In one day, FB erased all its gains from the Zuckerberg rally as measured from the open that day. Now, FB has essentially closed the entire gap.
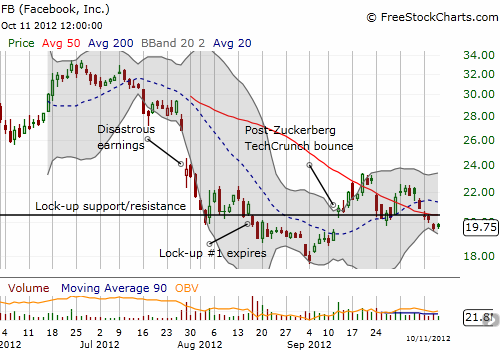
Source for charts: FreeStockCharts.com
Normally, I would say this churn around a key pivot point likely represents a bottom in the making. However, as much as 421M shares will come available for sale on November 14th. That amount represents significant overhang and almost no matter how FB does in its next earnings report, I am expecting FB to reach new all-time lows ahead of or immediately after the next lock-up expiration.
Be careful out there!
Full disclosure: long AAPL calls, long GOOG puts and calls, net short FB

long AAPL calls, long GOOG puts and calls, net short FB
please share what strike and months do you play om AAPL . GOOG, FB. thanks
I sold latest Apple call at a small loss today. GOOGLE strangle is 780/705 call/put. No options on FB, just shares. Note well these are subject to adjustment depending on market conditions, including stopping out.