(T2108 measures the percentage of stocks trading above their respective 40-day moving averages [DMAs]. It helps to identify extremes in market sentiment that are highly likely to reverse. To learn more about it, see my T2108 Resource Page. You can follow real-time T2108 commentary on twitter using the #T2108 hashtag. T2108-related trades and other trades are posted on twitter using the #120trade hashtag)
T2108 Status: 50.0%
VIX Status: 16.1
General (Short-term) Trading Call: Hold
Reference Charts (click for view of last 6 months from Stockcharts.com):
S&P 500 or SPY
SDS (ProShares UltraShort S&P500)
U.S. Dollar Index (volatility index)
VIX (volatility index)
VXX (iPath S&P 500 VIX Short-Term Futures ETN)
EWG (iShares MSCI Germany Index Fund)
CAT (Caterpillar)
Commentary
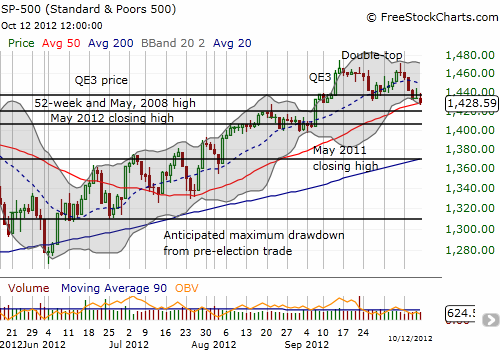
The bearish momentum on the S&P 500 continues to slowly build. On Friday, the S&P 500 closed right on top of its 50DMA (imagine that) after earlier in the day mounting a small rally from the previous day’s close. On Thursday, the index opened with the “obligatory bounce” I was expecting, but it did not last long.

The S&P 500 is now teetering. Lower lows, lower highs, double-top formation, second erasure of QE3 gains, and closing again below the May, 2008 high. A close below the 50DMA would be the first such occurrence since June 28th. Note well that the S&P 500 has yet to close below its 50DMA since it rallied strongly June 29th to close above the 50DMA.
T2108 dropped to 50.0%, its lowest close since, you guessed it, June 28th. It is “do or die” time for the index to hold support here.
These tensions are growing just as another earnings season kicks into high gear. I tend to distrust the market when it rallies into earnings. Sell-offs into earnings leave open the room for positive surprises. Currently, trepidation exists over earnings this quarter. Last month, Nightly Business Report provided this note of caution:
“… analysts predict companies in the S&P 500 will see earnings drop an average of 2 percent in the third quarter. If that happens, it will be the first such decline in three years. Tough comparisons are partly responsible, as last year’s third quarter was one of the best ever. On top of that, however, global demand remains weak.”
This is important context. Despite being one of the best third quarters ever, the S&P 500 still struggled to shake off 2011’s version of euro-panic. The rally that occurred through and after earnings in October, 2011 came to an end October 28th and marked a high for the rest of the year. The 200DMA capped trading for the rest of the year. In other words, while earnings may dominate trading for the next two weeks or so, we need to keep an eye on the technicals as the flood of earnings news slows to more of a trickle.
Daily T2108 vs the S&P 500
Click chart for extended view with S&P 500 fully scaled vertically (updated at least once a week)

Black line: T2108 (measured on the right); Green line: S&P 500 (for comparative purposes)
Weekly T2108

*All charts created using freestockcharts.com unless otherwise stated
Related links:
The T2108 Resource Page
Expanded daily chart of T2108 versus the S&P 500
Expanded weekly chart of T2108
Be careful out there!
Full disclosure: long SSO calls (worthless), long AAPL call (worthless), long GOOG calls and puts
