(T2108 measures the percentage of stocks trading above their respective 40-day moving averages [DMAs]. It helps to identify extremes in market sentiment that are highly likely to reverse. To learn more about it, see my T2108 Resource Page. You can follow real-time T2108 commentary on twitter using the #T2108 hashtag. T2108-related trades and other trades are posted on twitter using the #120trade hashtag)
T2108 Status: 52.4% (plunged from 70 to 60% previous day, ending last overbought period at 3 days long)
VIX Status: 16.3
General (Short-term) Trading Call: Hold
Reference Charts (click for view of last 6 months from Stockcharts.com):
S&P 500 or SPY
SDS (ProShares UltraShort S&P500)
U.S. Dollar Index (volatility index)
VIX (volatility index)
VXX (iPath S&P 500 VIX Short-Term Futures ETN)
EWG (iShares MSCI Germany Index Fund)
CAT (Caterpillar)
Commentary
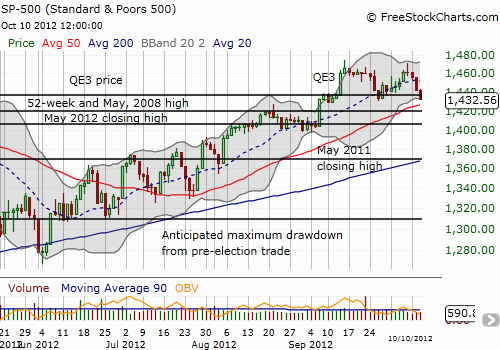
The bears are trying their best to prove a point but couldn’t quite end the day with an exclamation point (a close below the 50DMA). T2108 plunged for a second day in a row, closing today at 52.4%. This is its lowest level since July 25th. Yesterday, I tweeted that the plunge out of overbought territory looked bearish. Now adding to the bearish evidence is the S&P 500’s first lowest low since the rally began off the June 1st lows. The close is marginally lower but should not be taken lightly. Paired with the lower highs forming the potential double-top I pointed out two days ago, suddenly, the bears seem to be taking control. The chart below shows the current setup along with all the important price points.

Note well that this close also marks the second time the stock market has erased its gains since QE3 was announced almost a month ago. I consider this to be a very bearish signal. The stock market should have a lot more lift and enthusiasm with the wind of money-printing blowing underneath its sails. The one saving grace for the index is that the 50DMA lies directly below. I expect an “obligatory” bounce at any time given that support. However, only a fresh 52-week (and 5-year) high re-establishes the bias in favor of the bulls. Such a move voids the double-top technical signal.
These developments firmly re-establish standard T2108 rules. If the S&P 500 returns to overbought territory, I will be inclined to look for setups to fade/short. In particular, it seems drops out of overbought territory could be particularly lucrative. Waiting for such a move also greatly reduces the risk of getting caught shorting just as the market begins a new ramp higher. If the S&P 500 closes below the 50DMA, then shorts make sense just from a traditional technical perspective. Shorts stop out with a close above the 50DMA, and I would take profits at or around a retest of the 200DMA.
In the meantime, my few SSO calls are sure to expire worthless next week. I am also watching earnings with great interest with a particular eye for Apple (AAPL) {providing great intra-day volatility for trading} and Google (GOOG) {looking for large pre/post-earnings moves}. More on these in another post!
Daily T2108 vs the S&P 500
Click chart for extended view with S&P 500 fully scaled vertically (updated at least once a week)

Black line: T2108 (measured on the right); Green line: S&P 500 (for comparative purposes)
Weekly T2108

*All charts created using freestockcharts.com unless otherwise stated
Related links:
The T2108 Resource Page
Expanded daily chart of T2108 versus the S&P 500
Expanded weekly chart of T2108
Be careful out there!
Full disclosure: long SSO calls (worthless), long AAPL call (worthless), long GOOG calls and puts
