I watched Autozone (AZO) this morning stage another incredible comeback from post-earnings selling. In pre-market trading, AZO was down over 3% around $345. By the time trading opened, AZO rushed out the gate at $355. While it looked like a bottoming move, I failed to give the trade a try (with a stop below the pre-market low). Before I knew it, AZO was on its way to completing an impressive turn-around to a close above the 50 and 200-day moving averages (DMAs). These levels should have served as stiff resistance, especially after AZO’s high-volume plunge last Friday through them. In fact, I had assumed that AZO’s earnings would deliver follow-through selling. Instead, now, AZO seems set to resume its long-term uptrend. The charts below show the hourly, daily, and monthly action.
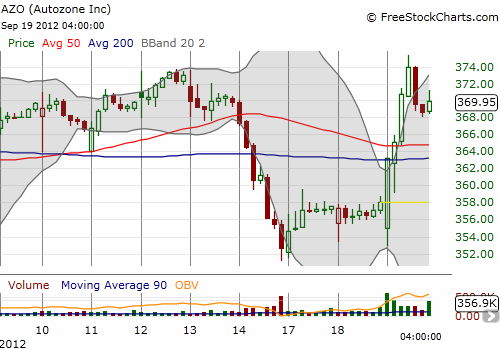
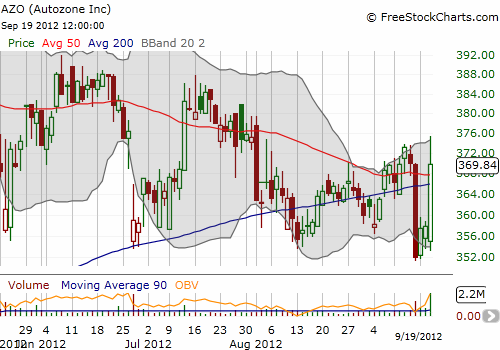
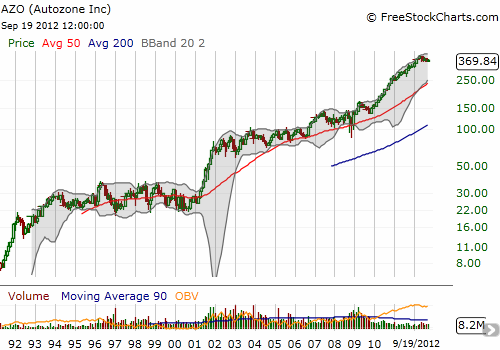
If AZO manages a higher close from current levels, a new bullish phase is confirmed. This should quickly lead to a big breakout from current congestion and a resumption of AZO’s long-term uptrend.
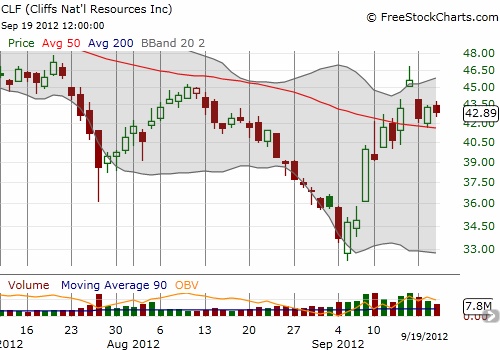
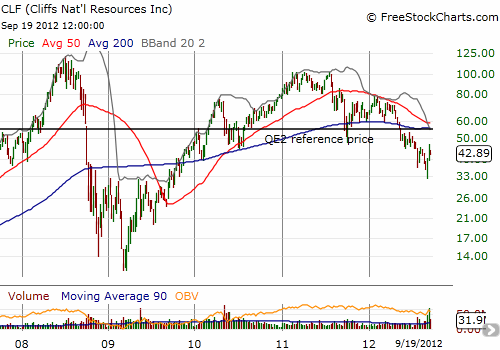
Cliffs Natural Resources (CLF) has formed a rare pattern called the “abandoned baby.” This candlestick pattern occurs when a stock significantly gaps up or down and subsequently gaps in reverse. In between, the stock makes very little progress and forms a “small body.” In CLF’s case, the stock gapped up, faded strongly from its highs on the day, and gapped back down. This is very bearish and can be considered an abandoned baby top. A slip below the 50DMA confirms the new bearish action. Breaking the abandoned baby signal by trading above the intraday high would be very bullish.
The charts below show the daily action and the longer-term bearish downtrend in place since 2011’s peak. Notice the surge in trading volume since CLF’s last bounce from the bottom. This indicates that a retest of the bottom is likely to be well-defended.
Source for charts: FreeStockCharts.com
Be careful out there!
Full disclosure: no positions

How much downside for Cliff before starting to head up again.
Thanks
I am thinking CLF will at least retest $36. If it can beat this bearish signal, it will be a very bullish sign for further gains from there.