(T2108 measures the percentage of stocks trading above their respective 40-day moving averages [DMAs]. It helps to identify extremes in market sentiment that are highly likely to reverse. To learn more about it, see my T2108 Resource Page. You can follow real-time T2108 commentary on twitter using the #T2108 hashtag. T2108-related trades and other trades are posted on twitter using the #120trade hashtag)
T2108 Status: 76.8% (overbought day #11)
VIX Status: 14.1
General (Short-term) Trading Call: Hold (extended overbought strategy remains in effect)
Reference Charts (click for view of last 6 months from Stockcharts.com):
S&P 500 or SPY
SDS (ProShares UltraShort S&P500)
U.S. Dollar Index (volatility index)
VIX (volatility index)
VXX (iPath S&P 500 VIX Short-Term Futures ETN)
EWG (iShares MSCI Germany Index Fund)
CAT (Caterpillar)
Commentary
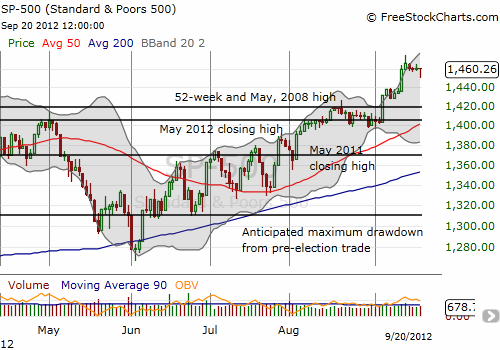
T2108 has been drifting through most of this 11-day overbought period (median duration is 4 days, average duration is 9 days). During that time, the S&P 500 has only gained 1.7%, almost all of that on one day – the day the Federal Reserve announced QE3 (one week ago on September 13th). The market has also provided very few opportunities for buying dips, even intraday. Until today, the dips have been extremely shallow and mostly not worth trading.

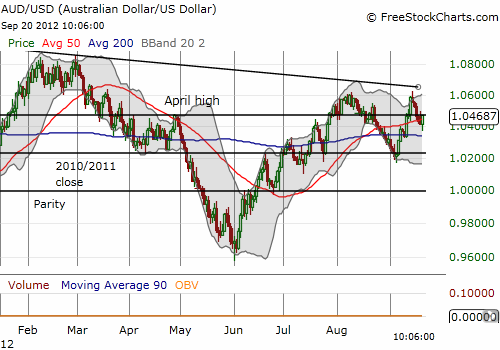
I bought SSO calls on Tuesday only to complete a trade that should have executed by the end of Monday’s weak close. These expire tomorrow, and I expect to at least break even on a decent open. I bought October calls on today’s dip. Once again, watching the intraday movements of the Australian dollar (FXA) helped me to time the buy. On a daily basis, the Australian dollar continues to send a yellow flag that keeps me wary. Against the U.S. dollar, the Aussie remains under a downtrend starting from last year’s historic peak, and the most recent rally stopped cold at the August highs. Until the Aussie begins another ramp, I will keep all bullish trades modest. Until then, I am actually marginally bearish on the Australian dollar.

Note well that the Aussie’s struggles are occurring even after the Federal Reserve’s announcement of QE3.
So, for now, the market awaits a new catalyst and reason to ramp. I think it is coming but, as these things go, the market likely has a few more tricks up its sleeve to trap bears and leave under-invested bulls behind! Trading could remain very quiet until October’s earnings season ignites with pre-announcements.
Daily T2108 vs the S&P 500
Click chart for extended view with S&P 500 fully scaled vertically (updated at least once a week)

Black line: T2108 (measured on the right); Green line: S&P 500 (for comparative purposes)
Weekly T2108

*All charts created using freestockcharts.com unless otherwise stated
Related links:
The T2108 Resource Page
Expanded daily chart of T2108 versus the S&P 500
Expanded weekly chart of T2108
Be careful out there!
Full disclosure: long SSO calls, short AUD/USD
