(T2108 measures the percentage of stocks trading above their respective 40-day moving averages [DMAs]. To learn more about it, see my T2108 Resource Page. You can follow real-time T2108 commentary on twitter using the #T2108 hashtag. T2108-related trades and other trades are posted on twitter using the #120trade hashtag)
T2108 Status: 65% (up from 57%)
VIX Status: 18.0
General (Short-term) Trading Call: Hold
Reference Charts (click for view of last 6 months from Stockcharts.com):
S&P 500 or SPY
SDS (ProShares UltraShort S&P500)
U.S. Dollar Index (volatility index)
VIX (volatility index)
VXX (iPath S&P 500 VIX Short-Term Futures ETN)
EWG (iShares MSCI Germany Index Fund)
Commentary
Even though buying volume is – surprise, surprise – fading, bulls get full credit for so quickly reversing the tide of sellers that washed the market out of overbought levels. T2108 jumped for a second day in a row. At 65%, T2108 is already sitting right under overbought conditions again. It appears the most bullish of my three post-overbought scenarios is playing out, albeit the one I thought the least likely given all the signals I observed. (As a reminder, there was an even chance of the S&P 500 dropping no more than 2% and no more than 8%). My reaction to this likely bullish outcome will be as planned. I am not standing down from the bearish T2108 position until I see the whites of the bull’s fiery face. That is, the S&P 500 must make a new 52-week (and multi-year) high on strong buying volume and a solid close to convince me that the next (overbought) rally is ready to begin.
The chart below shows the market’s remarkable ability to play with support and resistance. The selling appears to have ended right at the lower Bollinger Band, and Thursday’s buying spree ended perfectly at the former May, 2011 high (you simply cannot make this stuff up).

Transports have not confirmed the bullishness of industrials for much of 2012 – see Dow Theory. I am most interested in two participant stocks: CSX Corporation (CSX) and Caterpillar (CAT). After Tuesday’s sell-off, I posted a chart review of CAT demonstrating the ominous signals pointing to more selling ahead. With the market’s rally, CAT is already working on invalidating this bearish signal. The stock has already filled the large gap down below the 50DMA. Even the recent downtrend has ended. The falling volume weakens the significance of this reversal, but the trading action must still be respected. Notice carefully that stochastics are just now switching to oversold.

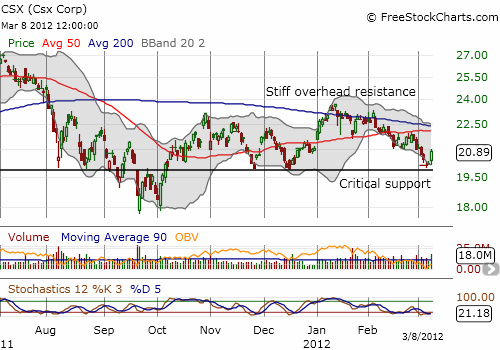
In the meantime, CSX bounced off critical support formed by November and December’s double-bottom. Note well that the stock peaked very early into 2012’s rally. Moreover, the stock is well off its 52-week highs. Even if CAT quickly breaks the stiff resistance at its all-time highs, transports like CSX will have a long path to catch-up to confirm the overall market rally. This setup also implies that CSX is a GREAT stock for playing a continuation of the stock market’s rally assuming that CSX must eventually catch up. Stochastics are also oversold here.

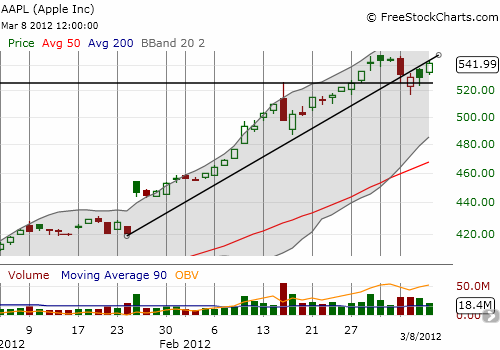
The stock chart for Apple (AAPL) also indicates that the leaders are trying to lead the stock market on a quick recovery. Tuesday’s sell-off broke Apple’s primary uptrend. The selling stopped right around the former all-time intraday highs from Apple’s big reversal day. The stock appears to be starting a new sharp uptrend. The strong, above average volume is EXACTLY what a trader wants to see in a rally. The buying power is quite awesome to behold and is very convincing.

Finally, volatility has cratered once again. After Tuesday’s impressive bounce above the 50DMA, the VIX has dropped right back into the trading area it has occupied for six weeks. The iPath S&P 500 VIX Short-Term Futures (VXX) is back to its lows for the year and looks ready to break to fresh all-time lows.
So, where does this all leave us? Given the bears continue to prove incapble of follow-through selling, the benefit of the doubt stays with the bulls, low volume and all. We technicians can keep complaining about low volume until we get blue in the face. However, the low volume matters little if the selling volume is even lower overall.
Charts below are the latest snapshots of T2108 (and the S&P 500)
Refresh browser if the charts are the same as the last T2108 update.
Black line: T2108 (measured on the right); Green line: S&P 500 (for comparative purposes)
Weekly T2108

*All charts created using freestockcharts.com unless otherwise stated
Related links:
The T2108 Resource Page
Expanded daily chart of T2108 versus the S&P 500
Expanded weekly chart of T2108
Be careful out there!
Full disclosure: long SDS and VXX; long VXX puts; long CAT puts

