I moderated my bullishness on the Australian dollar in early December because Australia’s terms of trade have likely peaked for now and the Reserve Bank of Australia had lowered rates twice. Last week, I recharged my bullishness on the Australian dollar after the Federal Reserve extended its dovish monetary policy. The Australian dollar experienced a strong rally leading into that statement that has matched the rally in the general U.S. stock market. So, this marks a great time to pause, take a deep breath, and review the overall technical picture on the Aussie.
Collectively, the evidence suggests that the Aussie is overdue for a pullback. However, if the Aussie can find firm support, it should launch a strong extension of its current rally. With a 4.25% interest rate on the Australian dollar, traders are paid very well to wait out any churn in between. This yield really adds up against the near-zero currencies in the U.S., Japan, the United Kingdom, and Switzerland.
The charts tell the stories.
AUD/USD – also Rydex CurrencyShares Australian Dollar Trust ETF (FXA)
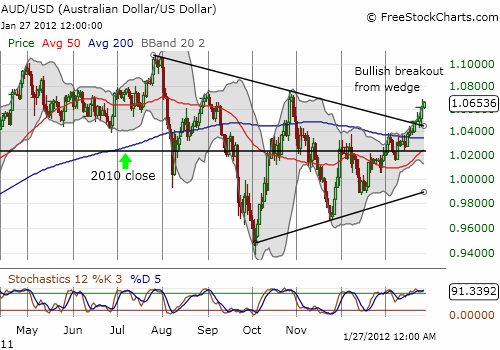
The Australian dollar spent the latter half of 2011 bouncing around flatline for the year. In cycling through a wedge pattern (lower highs and higher lows), The Aussie converged on the flatline to close 2011. After hitting the top of the wedge on Friday, January 20, the Aussie proceeded to breakout and has yet to look back. Stochastics have been extremely overbought since the breakout, so a swift pullback is likely imminent. I will be looking for support around 1.045 or at least the 200DMA directly below around 1.034. If it holds, I will aggressively add to positions in anticipation of an eventual retest of the all-time highs set last summer.

AUD/JPY
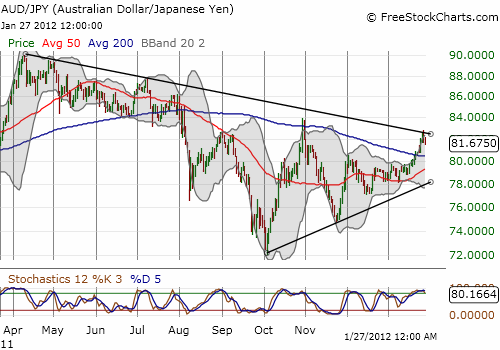
The Japanese yen’s strength has accelerated over the past year despite the interventionist attempts of monetary authorities to weaken the currency. Even the Australian dollar has been trapped under a general downtrend starting last Spring. The October lows ended a major divergence from this downtrend line, leading now to a wedge-like pattern bringing the Aussie right back to the downtrend line against the yen. AUD/JPY neatly pulled back from this line as stochastics became overbought. I am looking for the pullback to find support at the 50 or 200DMA. I want to re-enter AUD/JPY aggressively around 79 in anticipation of an eventual breakout above the downtrend line.

GBP/AUD
My new favorite way to play my bullishness on the Australian dollar is against the British pound. This currency pair forms a perfect match between my bullish and bearish biases. In the latter half of 2011, the pair bounced within a wide range making for many trading opportunities for fading strength in the British pound. The British pound is trading at all-time lows against the Australian dollar and is likely overdue for a snapback relief rally. I am currently holding a small position in case the pair continues to slide toward 1.45 (my first target). Otherwise, I will once again fade rallies in this pair very aggressively.
I am a firm bear on the British pound, and I am guessing that the Federal Reserve’s extension of near-zero rates for at least another year will put immense pressure on the Bank of England to further ease as well. While I anticipated major move downward in GBP/USD – also the Rydex Currency Shares British Pound Sterling Trust ETF (FXB) – I think the Australian dollar is a better way to play against weakness in the pound as long as the dollar trades downward from Fed actions.

AUD/CHF
I recently added this currency pair to my mix. It is a convenient way to play an eventual weakening in the franc from either matching weakness in the euro as the Swiss National Bank seeks to maintain its 1.20 floor against the euro OR the official establishment of a higher floor. (FreeStockCharts.com does not provide a chart for this pair.).
So why play the Australian dollar in so many ways? Well, I do not want to be overly dependent on any one given currency to behave bearishly enough to make playing the Australian dollar worth the risk. While all the major near-zero currencies are engaged in a game of chicken to the bottom (competitive devaluations), the pace of descent of any given currency varies greatly with macro-economic, governmental, and geo-political developments that are difficult to anticipate.
iShares MSCI Australia Index Fund ETF (EWA)
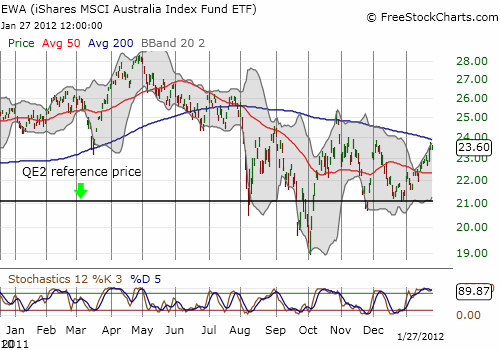
For good measure, I took a look at the ETF for Australian stocks. I sold my latest holdings last week. EWA is butting against overhead resistance at the 200DMA. As always, I like starting purchases around the “QE2 reference price” – where the Federal Reserve signaled the imminent arrival of QE2.

Source for charts: FreeStockCharts.com
Be careful out there!
Full disclosure: long FXA, AUD/USD, AUD/CHF; short GBP/AUD, GBP/USD

1 thought on “Chart Review: Australian Dollar Hitting Critical Junctures”